Technical Analysis of KSEA 2024-05-10
Overview:
In analyzing the technical indicators for KSEA stock over the last 5 days, we will delve into the trends, momentum, volatility, and volume aspects to provide a comprehensive outlook on the possible stock price movement in the coming days. By examining key indicators such as moving averages, MACD, RSI, Bollinger Bands, OBV, and more, we aim to offer valuable insights and predictions for informed decision-making.
Trend Analysis:
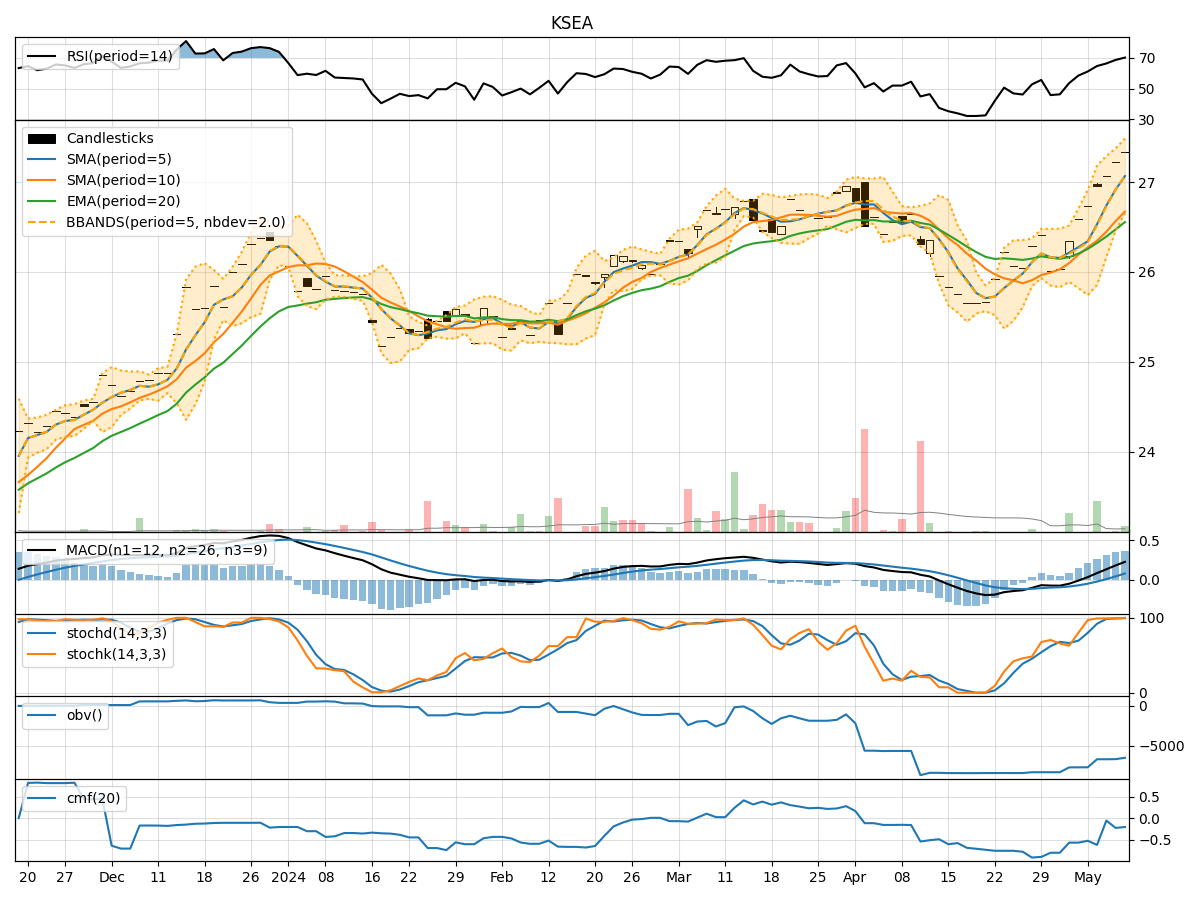
- Moving Averages (MA): The 5-day MA has been consistently above the closing prices, indicating an upward trend. This suggests a positive momentum in the stock price.
- MACD: The MACD line has been above the signal line for the past 5 days, with both lines showing an upward trajectory. This signals a bullish trend in the stock price.
Momentum Analysis:
- RSI: The RSI has been steadily increasing and is currently in the overbought territory, indicating a strong buying momentum. This could potentially lead to a continuation of the bullish trend.
- Stochastic Oscillator: Both %K and %D have been consistently high, suggesting that the stock is in overbought territory. This could imply a potential reversal or a period of consolidation.
Volatility Analysis:
- Bollinger Bands: The stock price has been trading within the upper Bollinger Band, indicating an overbought condition. This could lead to a short-term pullback or consolidation.
Volume Analysis:
- On-Balance Volume (OBV): The OBV has been fluctuating but has not shown a clear trend. This could indicate indecision among investors regarding the stock.
- Chaikin Money Flow (CMF): The CMF has been negative, suggesting that money is flowing out of the stock. This could be a bearish signal for the stock price.
Conclusion:
Based on the technical analysis of the trend, momentum, volatility, and volume indicators, the overall outlook for KSEA stock in the next few days leans towards a potential short-term pullback or consolidation. The stock has shown signs of being overbought, as indicated by the RSI and Stochastic Oscillator, which could lead to a temporary pause in the upward momentum. Additionally, the negative CMF and lack of clear trend in OBV suggest a cautious sentiment among investors.
Key Conclusion: The stock is likely to experience a short-term correction or consolidation before potentially resuming its upward trend. Traders should exercise caution and consider waiting for a better entry point before taking new positions.