Technical Analysis of KTEC 2024-05-10
Overview:
In analyzing the technical indicators for KTEC over the last 5 days, we will delve into the trend, momentum, volatility, and volume indicators to provide a comprehensive outlook on the possible stock price movement. By examining these key factors, we aim to offer valuable insights and predictions for the upcoming days.
Trend Analysis:
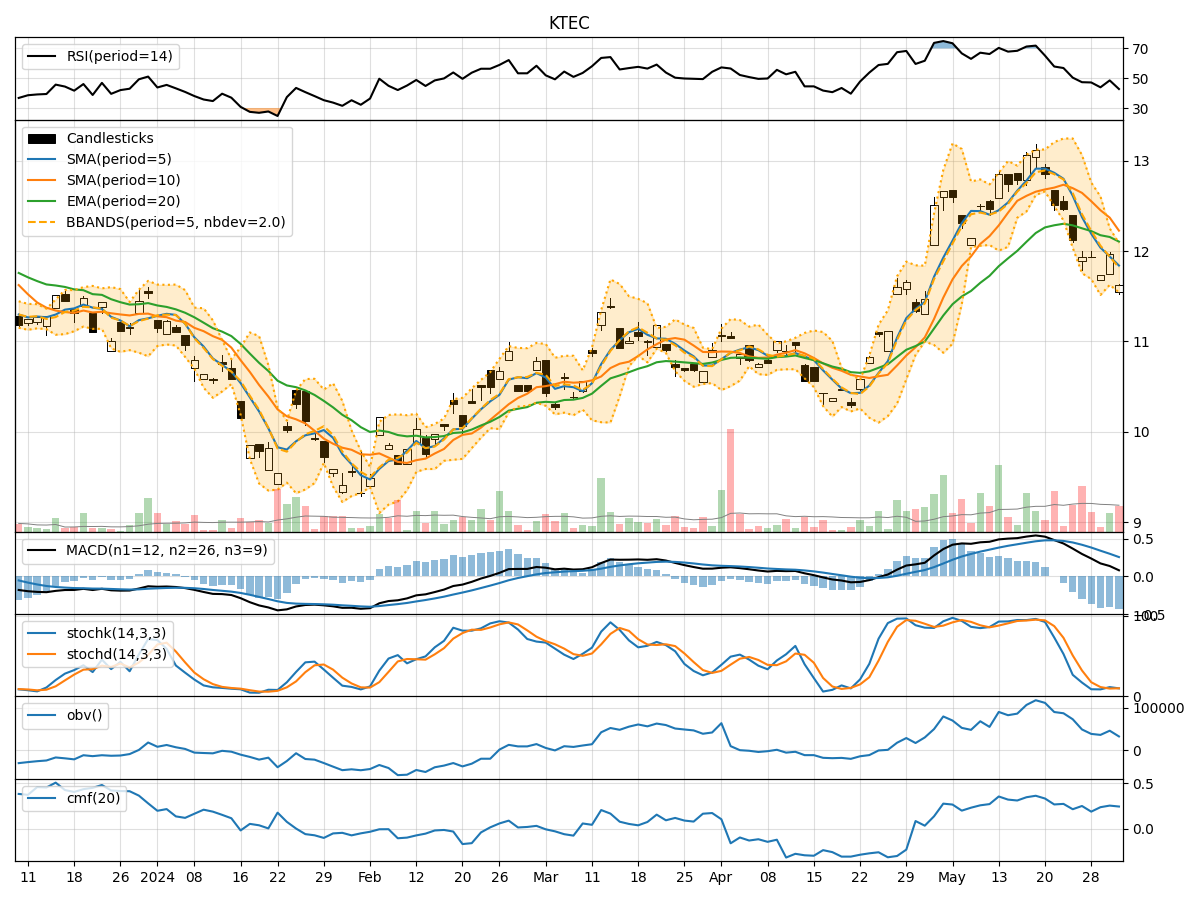
- Moving Averages (MA): The 5-day Moving Average (MA) has been consistently above the closing price, indicating a bullish trend.
- MACD: The Moving Average Convergence Divergence (MACD) shows positive values, suggesting upward momentum in the stock price.
- EMA: The Exponential Moving Average (EMA) has been trending upwards, supporting the bullish sentiment.
Key Observation: The trend indicators point towards an upward trend in the stock price.
Momentum Analysis:
- RSI: The Relative Strength Index (RSI) has been fluctuating around the overbought territory, indicating strong buying momentum.
- Stochastic Oscillator: Both %K and %D have been relatively high, suggesting bullish momentum.
- Williams %R: The Williams %R is hovering in the oversold region, indicating potential buying opportunities.
Key Observation: Momentum indicators signal a bullish sentiment in the stock.
Volatility Analysis:
- Bollinger Bands: The Bollinger Bands show a narrowing range, indicating decreasing volatility.
- Bollinger %B: The %B value is close to 1, suggesting the stock is trading near the upper band.
- Average True Range (ATR): ATR has been relatively stable, indicating consistent price movements.
Key Observation: Volatility indicators suggest a consolidation phase in the stock price.
Volume Analysis:
- On-Balance Volume (OBV): The OBV has been fluctuating but generally trending upwards, indicating buying pressure.
- Chaikin Money Flow (CMF): CMF is positive, suggesting money flow into the stock.
Key Observation: Volume indicators support the bullish sentiment in the stock.
Conclusion:
Based on the analysis of trend, momentum, volatility, and volume indicators, the overall outlook for KTEC stock is bullish. The trend is upward, momentum is strong, volatility is low, and volume is supportive of further price appreciation. Therefore, the next few days are likely to see the stock price continue its upward trajectory.
Recommendation:
Considering the bullish signals across various technical indicators, investors may consider buying KTEC stock for potential short to medium-term gains. However, it is essential to monitor the indicators regularly for any signs of reversal or divergence from the current trend.