Technical Analysis of KVLE 2024-05-10
Overview:
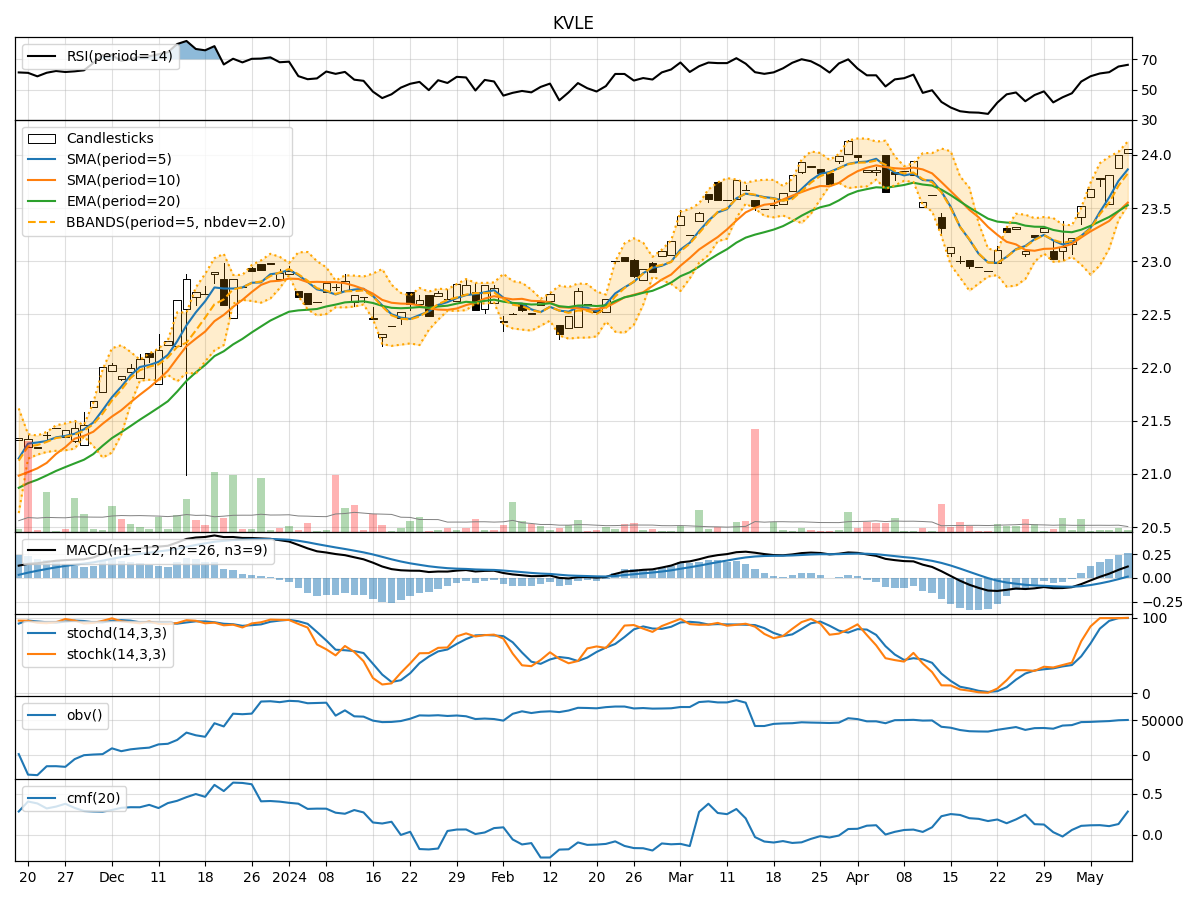
In analyzing the technical indicators for KVLE stock over the last 5 days, we will delve into the trend, momentum, volatility, and volume indicators to provide a comprehensive outlook on the possible stock price movement in the coming days. By examining these key indicators, we aim to offer valuable insights and predictions for potential investors.
Trend Analysis:
- Moving Averages (MA): The 5-day Moving Average (MA) has been consistently above the Simple Moving Average (SMA) and Exponential Moving Average (EMA), indicating a bullish trend.
- MACD: The MACD line has been consistently above the signal line, with both lines showing an upward trend, suggesting bullish momentum.
- MACD Histogram: The MACD Histogram has been increasing over the past 5 days, indicating strengthening bullish momentum.
Momentum Analysis:
- RSI: The Relative Strength Index (RSI) has been gradually increasing and is currently in the overbought territory, suggesting a strong bullish momentum.
- Stochastic Oscillator: Both %K and %D lines of the Stochastic Oscillator are in the overbought zone, indicating a strong bullish momentum.
- Williams %R: The Williams %R is at 0, signaling an overbought condition.
Volatility Analysis:
- Bollinger Bands (BB): The stock price has been consistently trading above the middle Bollinger Band (BBM), indicating an upward trend.
- Bollinger Band Width (BBW): The Bollinger Band Width has been narrowing, suggesting decreasing volatility.
- Bollinger Band %B (BBP): The %B indicator is above 0.8, indicating a strong bullish momentum.
Volume Analysis:
- On-Balance Volume (OBV): The OBV has been decreasing over the last 5 days, suggesting a divergence between price and volume.
- Chaikin Money Flow (CMF): The CMF has been gradually increasing, indicating buying pressure in the stock.
Key Observations:
- The trend indicators suggest a strong bullish sentiment with moving averages and MACD signaling an upward trend.
- Momentum indicators indicate an overbought condition, suggesting a potential pullback or consolidation.
- Volatility indicators show decreasing volatility, which may lead to a period of consolidation or sideways movement.
- Volume indicators reflect a divergence between price and volume, which could signal a potential reversal or correction.
Conclusion:
Based on the analysis of the technical indicators, the next few days for KVLE stock are likely to see a continuation of the upward trend in the short term. However, given the overbought conditions in the momentum indicators and the divergence in volume, there is a possibility of a short-term pullback or consolidation before potentially resuming the bullish trend. Traders should closely monitor key support and resistance levels for potential entry or exit points.