Technical Analysis of LABD 2024-05-31
Overview:
In analyzing the technical indicators for LABD over the last 5 days, we will delve into the trend, momentum, volatility, and volume indicators to provide a comprehensive outlook on the possible stock price movement in the coming days.
Trend Analysis:
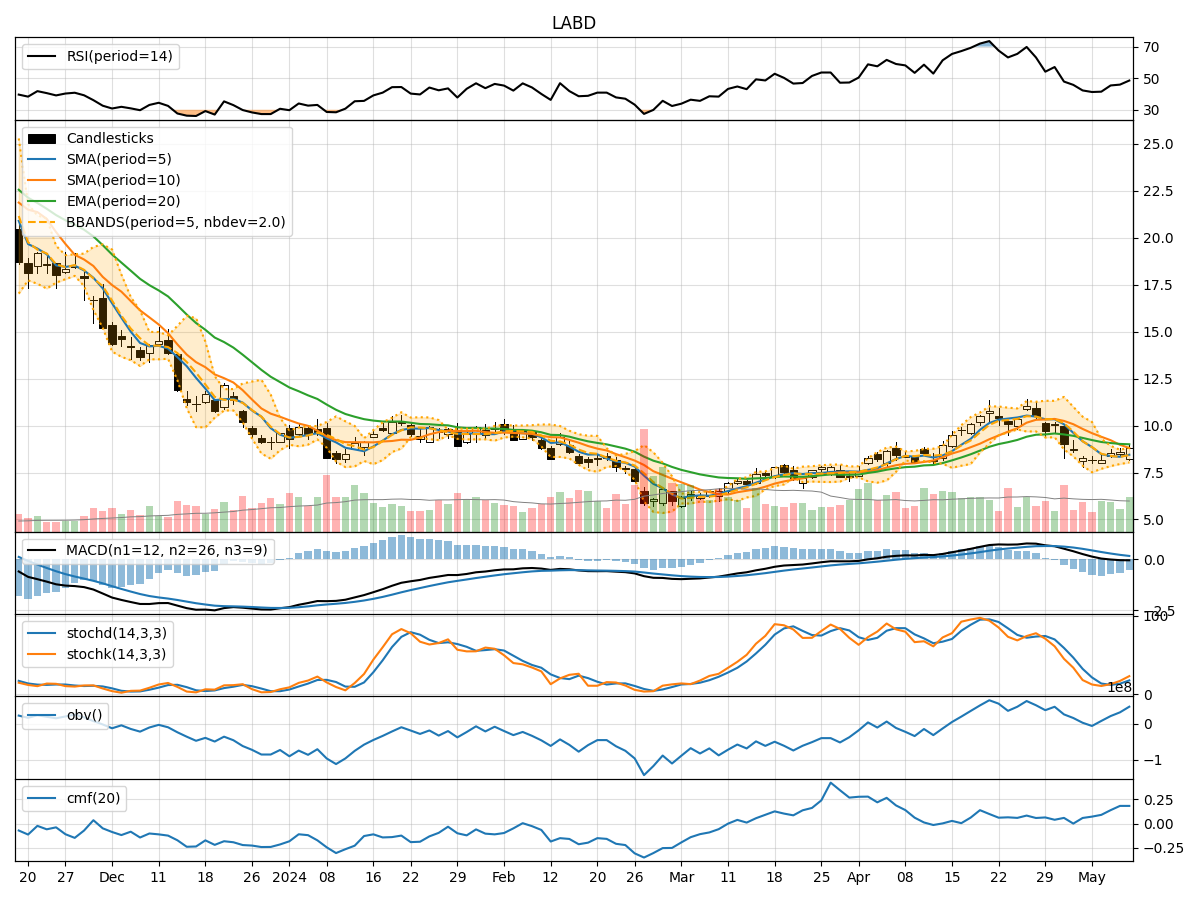
- Moving Averages (MA): The 5-day Moving Average has been consistently above the closing prices, indicating a potential bullish trend.
- MACD: The MACD line has been negative but showing signs of convergence towards the signal line, suggesting a possible trend reversal.
- EMA: The Exponential Moving Average has been relatively stable, reflecting a neutral to slightly bullish sentiment.
Momentum Analysis:
- RSI: The Relative Strength Index has been fluctuating around the 50 level, indicating a lack of strong momentum in either direction.
- Stochastic Oscillator: Both %K and %D have been hovering in the overbought territory, signaling a potential reversal or consolidation.
- Williams %R: The indicator has been in the oversold region, suggesting a possible bullish reversal.
Volatility Analysis:
- Bollinger Bands: The bands have been narrowing, indicating decreasing volatility and a potential breakout or significant price movement ahead.
- Bollinger %B: The %B indicator has been relatively stable, suggesting a period of consolidation or sideways movement.
Volume Analysis:
- On-Balance Volume (OBV): The OBV has been fluctuating, indicating mixed buying and selling pressure.
- Chaikin Money Flow (CMF): The CMF has been positive but declining, signaling a potential decrease in buying pressure.
Key Observations and Opinions:
- Trend: The trend indicators suggest a potential bullish bias, supported by the moving averages and EMA.
- Momentum: Momentum indicators show mixed signals, with RSI indicating neutrality, Stochastic suggesting a possible reversal, and Williams %R hinting at a bullish sentiment.
- Volatility: Volatility indicators point towards a potential breakout or significant price movement in the near future.
- Volume: Volume indicators reflect mixed market participation, with OBV and CMF showing conflicting signals.
Conclusion:
Based on the analysis of the technical indicators, the next few days for LABD could see upward price movement with a potential breakout, supported by the bullish trend signals from moving averages and EMA. However, caution is advised due to mixed signals from momentum and volume indicators, indicating a need for further confirmation before entering a position. Traders should closely monitor the narrowing Bollinger Bands for a potential breakout confirmation and watch for any divergence or confirmation in momentum indicators for a clearer direction.