Technical Analysis of LABU 2024-05-10
Overview:
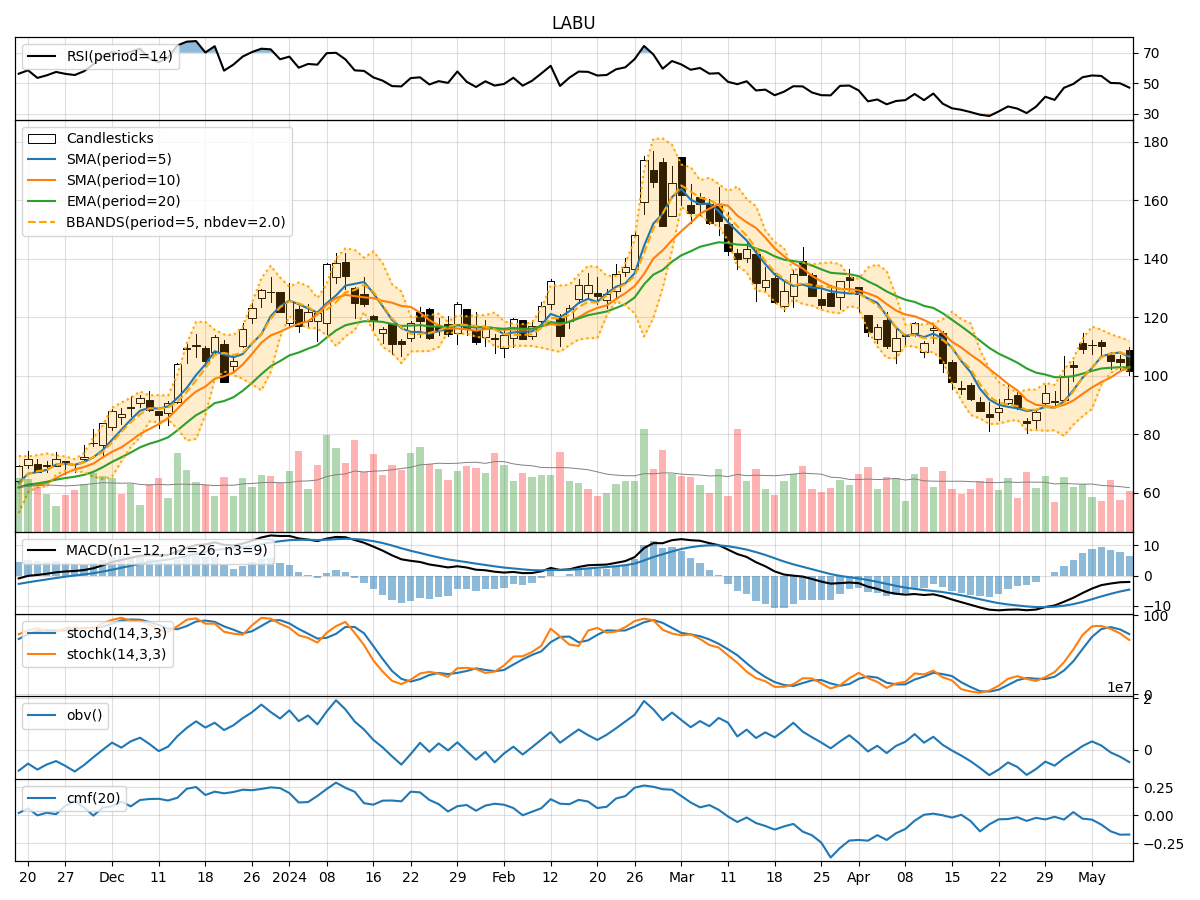
In analyzing the technical indicators for LABU over the last 5 days, we will delve into the trend, momentum, volatility, and volume indicators to provide a comprehensive outlook on the possible stock price movement. By examining these key aspects, we aim to offer valuable insights and predictions for the upcoming trading days.
Trend Analysis:
- Moving Averages (MA): The 5-day Moving Average (MA) has been declining, indicating a short-term bearish trend.
- MACD: The MACD line has been decreasing, suggesting a weakening bullish momentum.
- RSI: The Relative Strength Index (RSI) has been declining, indicating a loss of strength in the current trend.
Key Observation: The trend indicators point towards a bearish sentiment in the short term.
Momentum Analysis:
- Stochastic Oscillator: Both %K and %D have been decreasing, signaling a potential bearish momentum.
- Williams %R: The Williams %R is in the oversold territory, indicating a possible reversal or continuation of the downtrend.
Key Observation: Momentum indicators suggest a bearish momentum in the near future.
Volatility Analysis:
- Bollinger Bands: The Bollinger Bands have been narrowing, indicating decreasing volatility.
- Bollinger %B: The %B is below 0.2, suggesting the stock is oversold.
Key Observation: Volatility indicators point towards a decrease in volatility and a potential reversal in the stock price.
Volume Analysis:
- On-Balance Volume (OBV): The OBV has been decreasing, indicating selling pressure in the stock.
- Chaikin Money Flow (CMF): The CMF is negative, suggesting a bearish money flow.
Key Observation: Volume indicators reflect a bearish sentiment with increasing selling pressure.
Conclusion:
Based on the analysis of trend, momentum, volatility, and volume indicators, the overall outlook for LABU in the next few days is bearish. The stock is likely to experience further downward movement, potentially entering a consolidation phase or a continued downtrend. Traders and investors should exercise caution and consider shorting or staying on the sidelines until a clear reversal signal is observed.
Key Takeaways:
- Direction: Downward
- Recommendation: Consider short positions or wait for a reversal confirmation
- Risk Management: Set stop-loss orders to manage downside risk
- Monitoring: Keep a close eye on key support levels for potential bounce opportunities
By integrating these technical insights and recommendations, traders can make informed decisions aligned with the prevailing market dynamics and maximize their trading strategies.