Technical Analysis of LALT 2024-05-10
Overview:
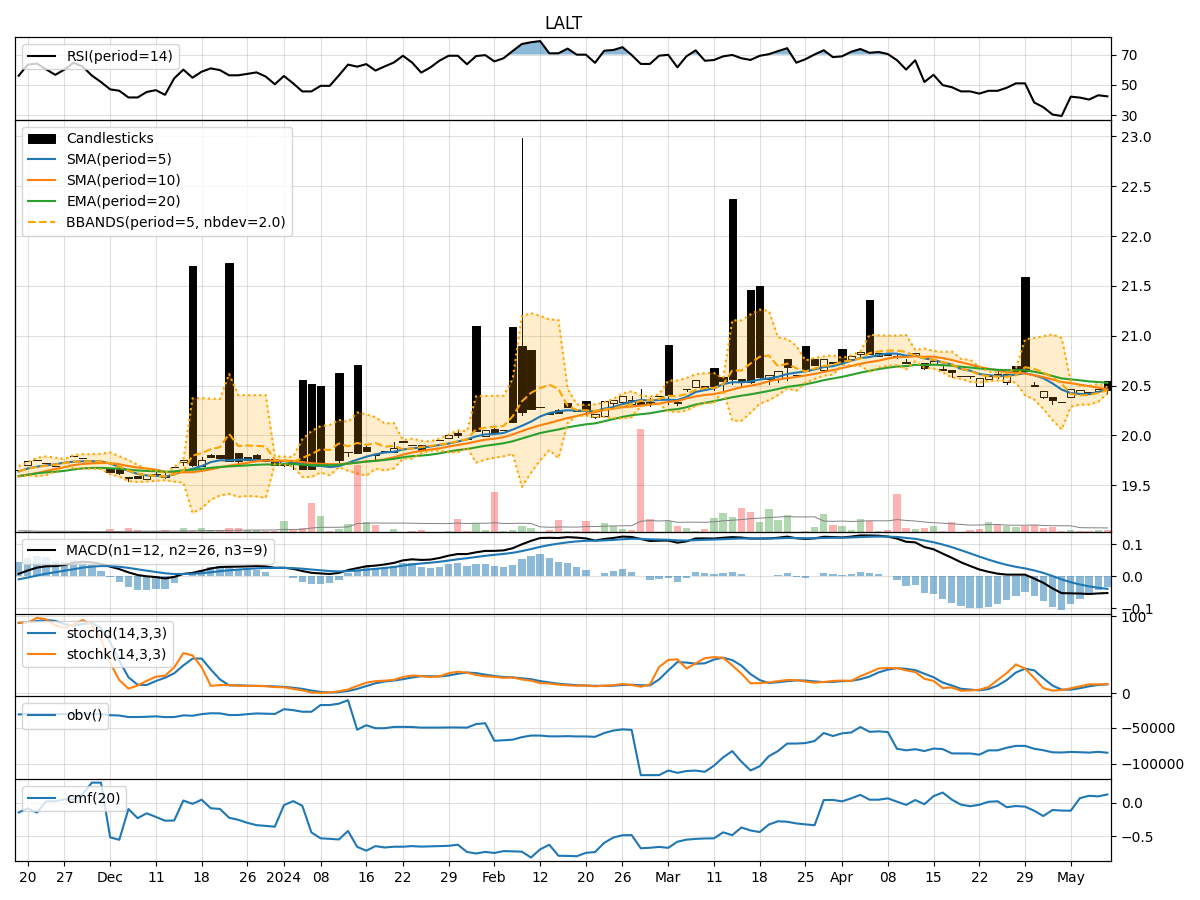
In analyzing the technical indicators for LALT over the last 5 days, we will delve into the trend, momentum, volatility, and volume indicators to provide a comprehensive assessment of the stock's potential price movement. By examining these key factors, we aim to offer valuable insights and predictions for the next few days.
Trend Analysis:
- Moving Averages (MA): The 5-day MA has been relatively stable around the current price, indicating a lack of strong directional momentum.
- MACD: The MACD line has been consistently negative, suggesting a bearish trend in the short term.
- EMA: The EMA has been gradually declining, further supporting the bearish sentiment in the stock.
Key Observation: The trend indicators point towards a bearish outlook for LALT in the near future.
Momentum Analysis:
- RSI: The RSI values have been hovering around the mid-range, indicating a lack of strong momentum in either direction.
- Stochastic Oscillator: Both %K and %D values have been relatively flat, suggesting a lack of significant buying or selling pressure.
- Williams %R: The Williams %R values have been consistently in the oversold territory, indicating a potential reversal in the stock price.
Key Observation: Momentum indicators suggest a neutral to slightly bearish sentiment for LALT.
Volatility Analysis:
- Bollinger Bands (BB): The bands have been narrowing, indicating decreasing volatility in the stock.
- Bollinger %B: The %B value has been fluctuating around the midline, reflecting a lack of clear trend direction.
Key Observation: Volatility indicators signal a consolidation phase for LALT with a potential breakout in either direction.
Volume Analysis:
- On-Balance Volume (OBV): The OBV values have been fluctuating, indicating mixed buying and selling pressure.
- Chaikin Money Flow (CMF): The CMF values have been positive, suggesting a slight inflow of money into the stock.
Key Observation: Volume indicators show a mixed sentiment with no clear dominance of buying or selling pressure.
Conclusion:
Based on the analysis of trend, momentum, volatility, and volume indicators, the overall outlook for LALT in the next few days is bearish with a potential for consolidation before a possible breakout. Traders should exercise caution and wait for a clearer signal before taking any significant positions. It is advisable to closely monitor key support and resistance levels for potential entry or exit points.
Key Takeaways:
- Trend: Bearish
- Momentum: Neutral to Slightly Bearish
- Volatility: Consolidation
- Volume: Mixed
In conclusion, a cautious approach is recommended for traders looking to engage with LALT in the upcoming trading sessions.