Technical Analysis of LCF 2024-05-10
Overview:
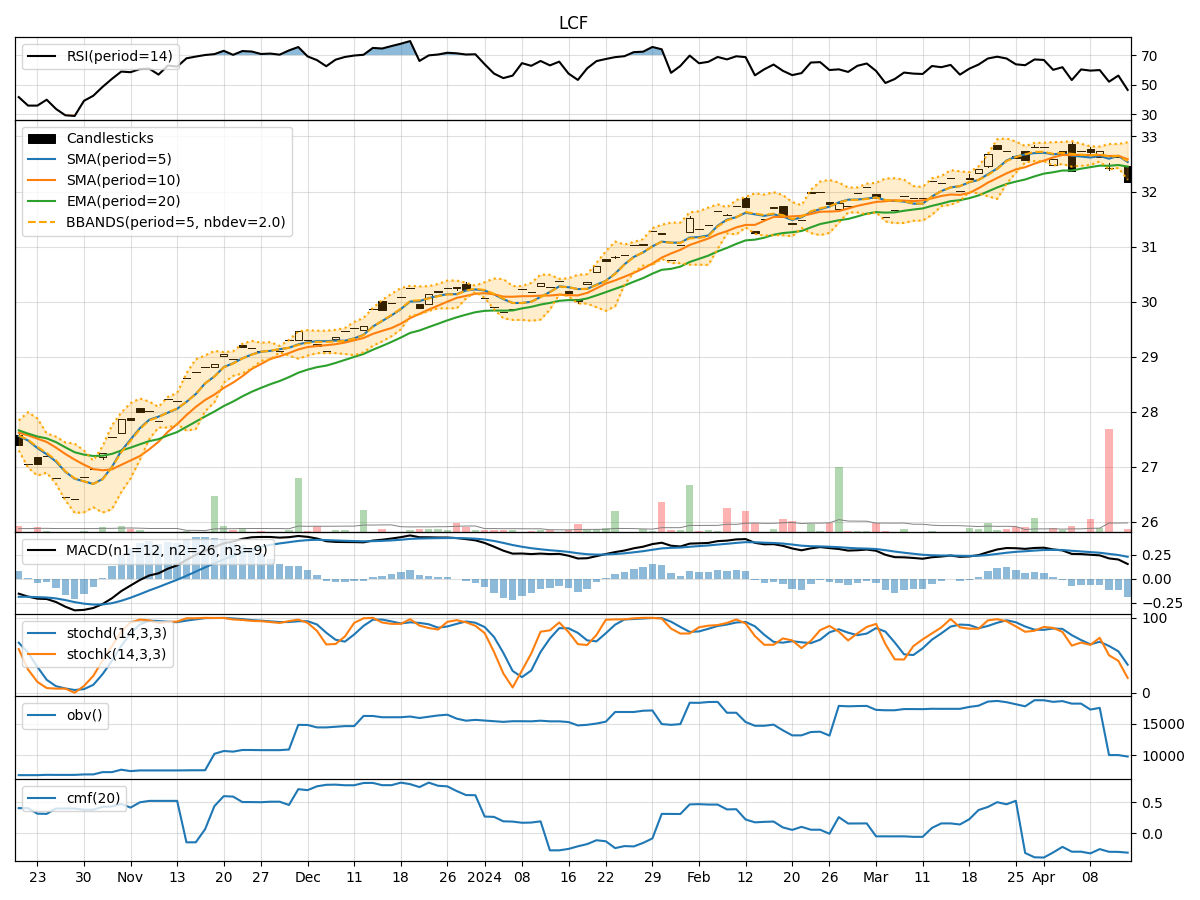
In analyzing the technical indicators for LCF stock over the last 5 days, we will delve into the trend, momentum, volatility, and volume indicators to provide a comprehensive outlook on the possible stock price movement in the coming days. By examining these key indicators, we aim to offer valuable insights and predictions for informed decision-making.
Trend Indicators:
- Moving Averages (MA): The 5-day MA has been consistently above the closing prices, indicating a short-term uptrend.
- MACD: The MACD line has been positive, showing bullish momentum.
- MACD Histogram: The histogram has been increasing, suggesting strengthening bullish momentum.
Key Observation: The trend indicators point towards a bullish sentiment in the stock price movement.
Momentum Indicators:
- RSI: The RSI has been trending upwards, indicating increasing buying pressure.
- Stochastic Oscillator: Both %K and %D have been at 100%, signaling strong bullish momentum.
- Williams %R: The indicator has been consistently at 0, reflecting overbought conditions.
Key Observation: Momentum indicators suggest a strong bullish sentiment in the stock.
Volatility Indicators:
- Bollinger Bands (BB): The bands have been narrowing, indicating decreasing volatility.
- Bollinger %B: The %B has been increasing, suggesting a potential breakout.
Key Observation: Volatility indicators point towards a potential breakout in the stock price.
Volume Indicators:
- On-Balance Volume (OBV): The OBV has been slightly decreasing, indicating some distribution.
- Chaikin Money Flow (CMF): The CMF has been negative, signaling outflow of money from the stock.
Key Observation: Volume indicators show a mixed sentiment with slight distribution.
Conclusion:
Based on the analysis of the technical indicators, the overall outlook for LCF stock in the next few days is bullish with strong momentum and a potential breakout indicated by decreasing volatility. However, the slight decrease in OBV and negative CMF suggest some caution as there might be some distribution happening. Traders and investors should closely monitor the price action for confirmation of the bullish trend and potential breakout. Consider buying on dips for potential upside movement.