Technical Analysis of LCG 2024-05-10
Overview:
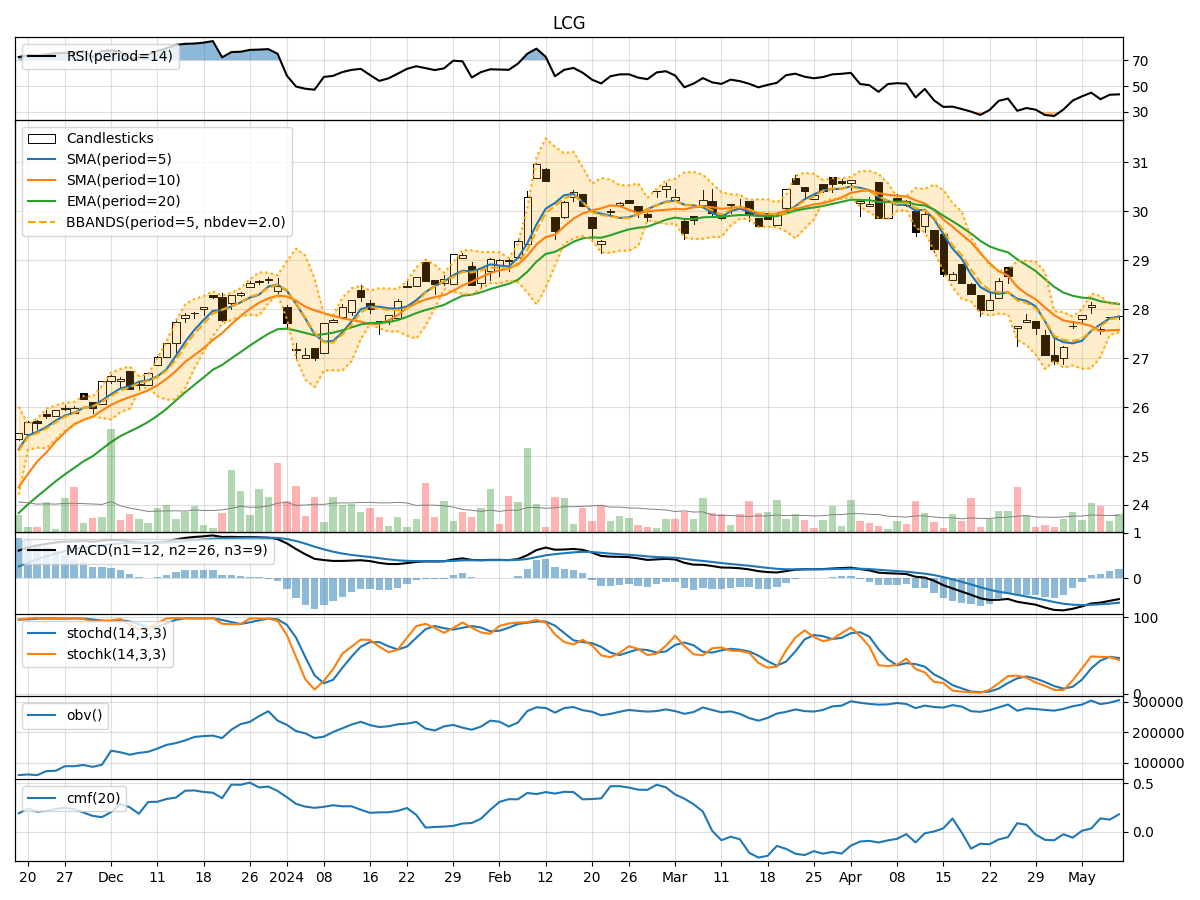
In analyzing the technical indicators for LCG over the last 5 days, we will delve into the trend, momentum, volatility, and volume indicators to provide a comprehensive outlook on the possible stock price movement in the coming days. By examining these key aspects, we aim to offer valuable insights and recommendations for potential investors.
Trend Analysis:
- Moving Averages (MA): The 5-day Moving Average (MA) has been consistently above the closing prices, indicating a short-term uptrend.
- MACD: The MACD line has been gradually increasing, showing a potential bullish momentum.
- EMA: The Exponential Moving Average (EMA) has been declining slightly, suggesting a possible weakening of the trend.
Momentum Analysis:
- RSI: The Relative Strength Index (RSI) has been fluctuating around the mid-level, indicating a neutral momentum.
- Stochastic Oscillator: Both %K and %D have been hovering around the overbought territory, signaling a potential reversal.
- Williams %R: The Williams %R is also in the oversold region, suggesting a possible upcoming bounce.
Volatility Analysis:
- Bollinger Bands (BB): The Bollinger Bands have been narrowing, indicating decreasing volatility.
- BB %B: The %B indicator is relatively low, suggesting a potential consolidation phase.
Volume Analysis:
- On-Balance Volume (OBV): The OBV has shown an overall increase, indicating accumulation by investors.
- Chaikin Money Flow (CMF): The CMF has been positive, reflecting buying pressure in the stock.
Key Observations:
- The trend indicators suggest a mixed outlook with a slight bullish bias.
- Momentum indicators point towards a potential reversal or consolidation phase.
- Volatility indicators indicate decreasing volatility and a possible period of consolidation.
- Volume indicators show accumulation and buying pressure in the stock.
Conclusion:
Based on the analysis of the technical indicators, the next few days for LCG stock price movement could be sideways with a slight bullish bias. Investors may expect the stock to consolidate within a narrow range, potentially followed by a modest uptrend. It is advisable to closely monitor key support and resistance levels for potential entry or exit points.