Technical Analysis of LCLG 2024-05-10
Overview:
In analyzing the technical indicators for LCLG stock over the last 5 days, we will delve into the trend, momentum, volatility, and volume indicators to provide a comprehensive outlook on the possible stock price movement in the coming days. By examining these key indicators, we aim to offer valuable insights and predictions to guide investment decisions.
Trend Indicators:
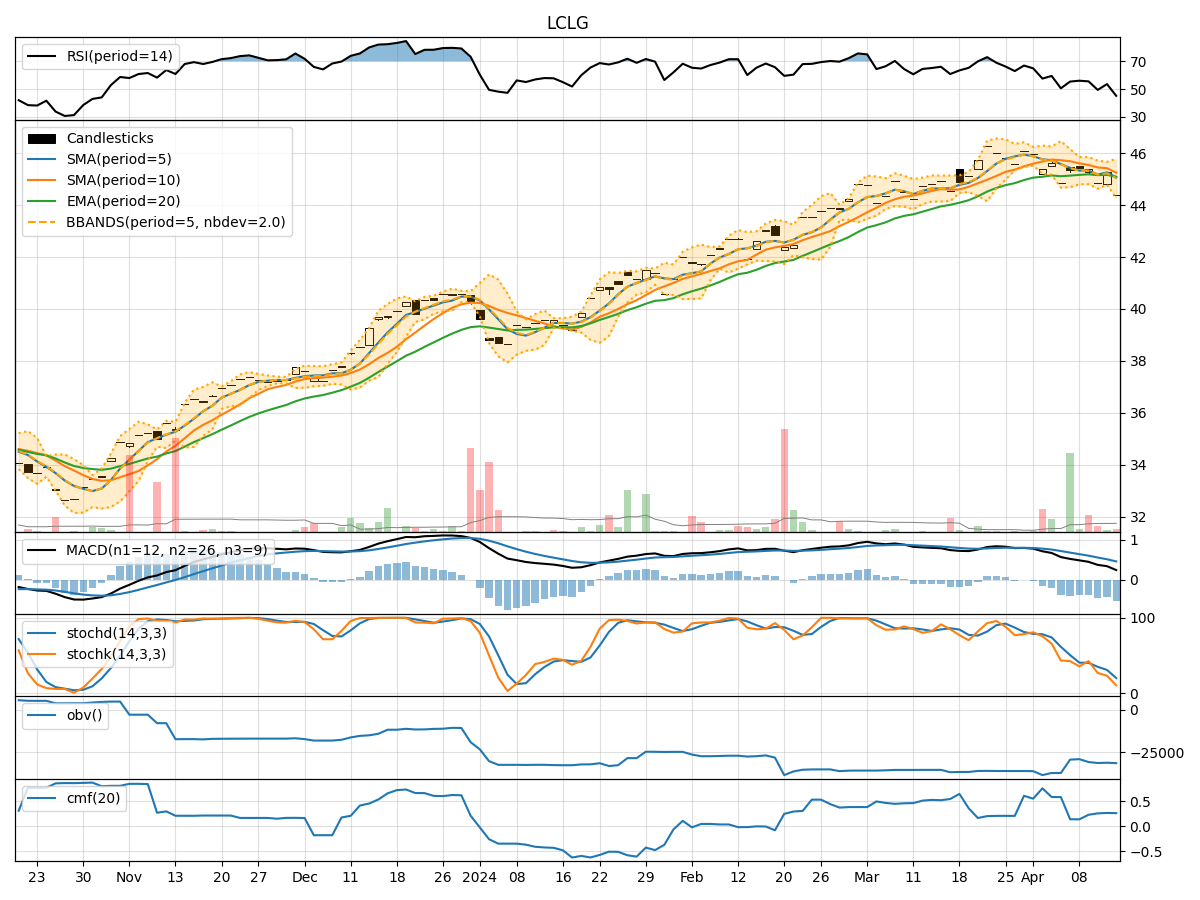
- Moving Averages (MA): The 5-day Moving Average (MA) has been steadily increasing, indicating a positive trend in the stock price.
- MACD: The MACD line has been consistently above the signal line, suggesting bullish momentum in the stock.
- EMA: The Exponential Moving Average (EMA) has been trending upwards, supporting the bullish sentiment in the stock.
Momentum Indicators:
- RSI: The Relative Strength Index (RSI) has been increasing, showing strengthening momentum in the stock.
- Stochastic Oscillator: Both %K and %D have been at high levels, indicating overbought conditions in the stock.
- Williams %R: The Williams %R is at 0, signaling a potential reversal in the stock price.
Volatility Indicators:
- Bollinger Bands: The Bollinger Bands have been widening, suggesting increased volatility in the stock.
- Bollinger %B: The %B indicator is above 0.8, indicating that the stock is trading near the upper Bollinger Band.
Volume Indicators:
- On-Balance Volume (OBV): The OBV has been decreasing, indicating selling pressure in the stock.
- Chaikin Money Flow (CMF): The CMF has been negative, suggesting outflow of money from the stock.
Key Observations and Opinions:
- Trend: The stock is in an upward trend based on the moving averages and MACD.
- Momentum: Momentum indicators suggest that the stock is overbought and may experience a pullback.
- Volatility: Increasing volatility could lead to larger price swings in the stock.
- Volume: The decreasing OBV and negative CMF indicate bearish sentiment in the stock.
Conclusion:
Based on the analysis of the technical indicators, the next few days' possible stock price movement for LCLG is likely to experience a short-term pullback due to overbought conditions and negative volume indicators. Traders should exercise caution and consider waiting for a better entry point before considering long positions.