Technical Analysis of LCTD 2024-05-10
Overview:
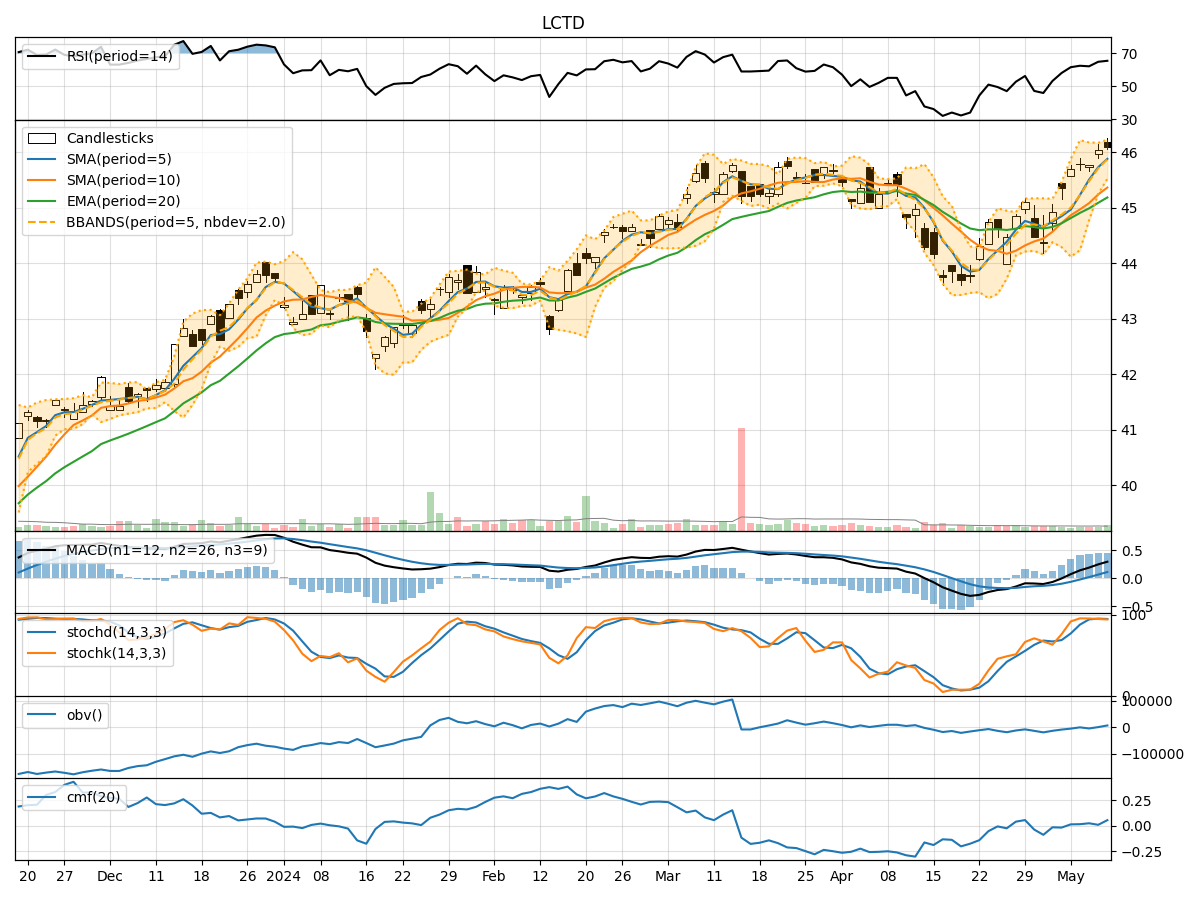
In analyzing the technical indicators for LCTD over the last 5 days, we will delve into the trend, momentum, volatility, and volume indicators to provide a comprehensive outlook on the possible stock price movement in the coming days.
Trend Analysis:
- Moving Averages (MA): The 5-day Moving Average has been consistently above the Simple Moving Average (SMA) and Exponential Moving Average (EMA), indicating a bullish trend.
- MACD: The MACD line has been above the signal line for the past 5 days, with the MACD Histogram showing an increasing positive trend, suggesting further upward momentum.
Momentum Analysis:
- RSI: The Relative Strength Index (RSI) has been trending upwards, indicating increasing buying pressure.
- Stochastic Oscillator: Both %K and %D lines of the Stochastic Oscillator have been in the overbought zone, suggesting a strong bullish momentum.
- Williams %R: The Williams %R has been consistently in the oversold territory, indicating a potential reversal to the upside.
Volatility Analysis:
- Bollinger Bands: The stock price has been trading within the Bollinger Bands, with the bands narrowing, indicating decreasing volatility.
- Bollinger %B: The %B indicator has been hovering around 0.8, suggesting the stock is trading near the upper band.
Volume Analysis:
- On-Balance Volume (OBV): The OBV has been steadily increasing over the last 5 days, indicating strong buying volume.
- Chaikin Money Flow (CMF): The CMF has been positive, reflecting buying pressure in the stock.
Conclusion:
Based on the analysis of the technical indicators: - Trend: The stock is in a strong uptrend supported by moving averages and MACD. - Momentum: Momentum indicators suggest a bullish sentiment with overbought conditions. - Volatility: Volatility is decreasing, indicating a possible period of consolidation. - Volume: Increasing OBV and positive CMF signal strong buying interest.
Forecast:
Considering the overall bullish trend, strong momentum, decreasing volatility, and increasing buying volume, the next few days are likely to see the stock price continue its upward movement. Traders and investors may consider buying opportunities in anticipation of further price appreciation. It is essential to monitor the indicators closely for any signs of reversal or overextension in the bullish trend.