Technical Analysis of LCTU 2024-05-10
Overview:
In analyzing the technical indicators for LCTU over the last 5 days, we will delve into the trend, momentum, volatility, and volume indicators to provide a comprehensive outlook on the possible stock price movement in the coming days. By examining these key aspects, we aim to offer valuable insights and predictions for informed decision-making.
Trend Analysis:
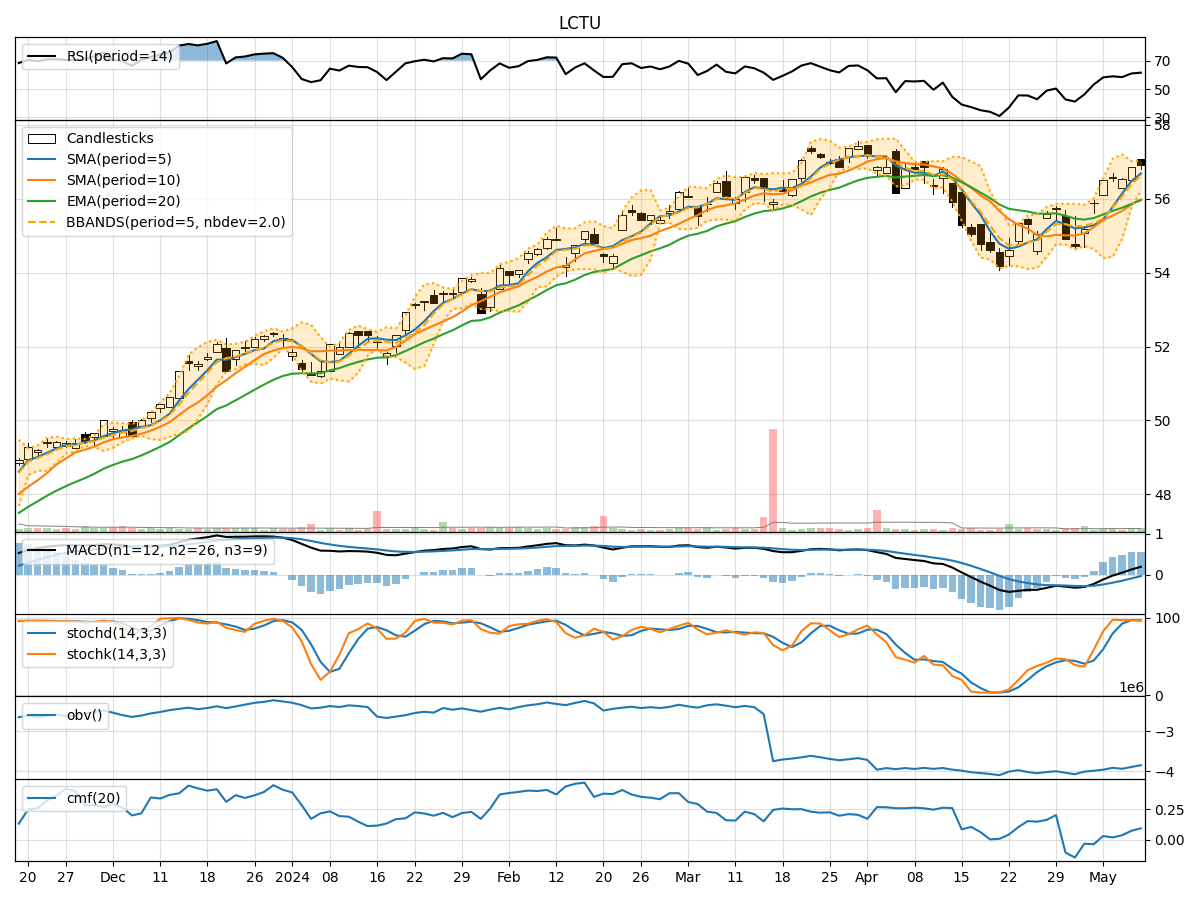
- Moving Averages (MA): The 5-day MA has been consistently above the 10-day SMA, indicating a short-term bullish trend. The EMA(20) has shown a gradual uptrend, supporting a positive momentum.
- MACD: The MACD line has been above the signal line for the past 5 days, suggesting a bullish momentum in the stock price.
- Conclusion: The trend indicators suggest an upward momentum in the stock price.
Momentum Analysis:
- RSI: The RSI has been trending upwards and is currently in the overbought territory, indicating a strong buying momentum.
- Stochastic Oscillator: Both %K and %D have been consistently high, reflecting strong bullish momentum.
- Conclusion: The momentum indicators signal a bullish sentiment in the stock.
Volatility Analysis:
- Bollinger Bands (BB): The stock price has been trading within the upper Bollinger Band, indicating an increased volatility but also potential overbought conditions.
- Conclusion: The volatility indicators suggest a potential consolidation or a short-term pullback due to the overbought conditions.
Volume Analysis:
- On-Balance Volume (OBV): The OBV has shown a slight decrease over the last 5 days, indicating some distribution happening in the stock.
- Chaikin Money Flow (CMF): The CMF(20) has been positive, suggesting buying pressure in the stock.
- Conclusion: The volume indicators point towards mixed signals, with some distribution in volume but overall positive buying pressure.
Conclusion:
Based on the analysis of trend, momentum, volatility, and volume indicators, the overall outlook for LCTU in the next few days is bullish with a potential for upward movement in the stock price. However, considering the overbought conditions indicated by the volatility indicators, there might be a short-term pullback or consolidation before the uptrend resumes. Traders and investors should closely monitor the price action and volume dynamics to capitalize on potential buying opportunities during any pullbacks.