Technical Analysis of LDEM 2024-05-10
Overview:
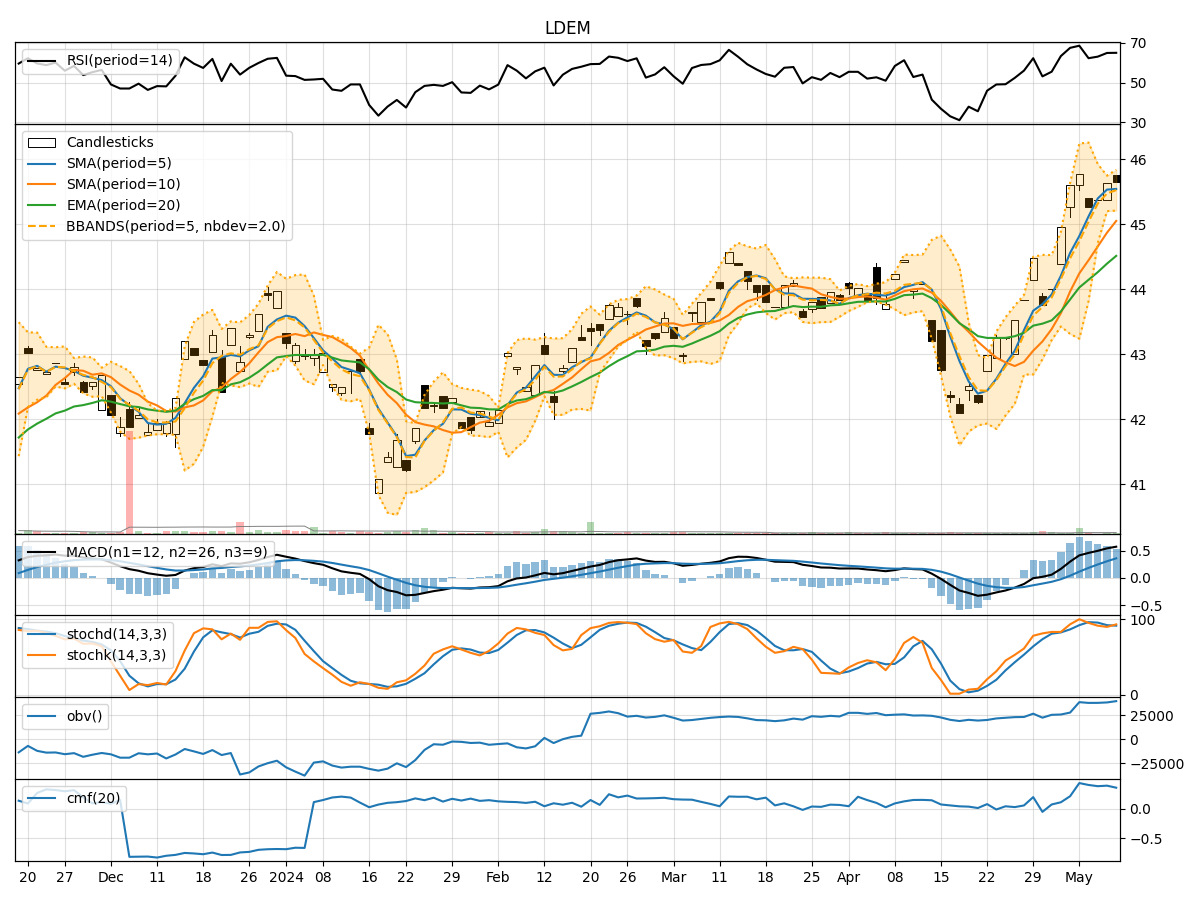
In analyzing the technical indicators for LDEM stock over the last 5 days, we will delve into the trend, momentum, volatility, and volume indicators to provide a comprehensive outlook on the possible stock price movement in the coming days.
Trend Indicators:
- Moving Averages (MA): The 5-day MA has been consistently above the closing price, indicating a bullish trend.
- MACD: The MACD line has been above the signal line, suggesting a bullish momentum.
- EMA: The exponential moving average has been trending upwards, supporting the bullish sentiment.
Momentum Indicators:
- RSI: The RSI has been in the overbought territory, indicating a strong bullish momentum.
- Stochastic Oscillator: Both %K and %D have been relatively high, signaling a strong bullish momentum.
- Williams %R: The indicator has been in the oversold region, suggesting a potential reversal.
Volatility Indicators:
- Bollinger Bands: The bands have been narrowing, indicating decreasing volatility.
- Bollinger %B: The %B has been hovering around 0.5, suggesting a balanced market sentiment.
Volume Indicators:
- On-Balance Volume (OBV): The OBV has been trending upwards, indicating accumulation by investors.
- Chaikin Money Flow (CMF): The CMF has been positive, reflecting buying pressure in the stock.
Key Observations:
- The trend indicators, momentum indicators, and volume indicators all point towards a bullish sentiment in the stock.
- The narrowing Bollinger Bands suggest a period of consolidation or a potential breakout.
- The RSI and Stochastic Oscillator indicate a strong bullish momentum, while the Williams %R suggests a possible reversal in the short term.
Conclusion:
Based on the analysis of the technical indicators, the next few days' possible stock price movement for LDEM is likely to be upward with a potential for a breakout. Investors may consider buying opportunities in anticipation of further price appreciation. However, it is essential to monitor the indicators closely for any signs of reversal or increased volatility.