Technical Analysis of LDSF 2024-05-10
Overview:
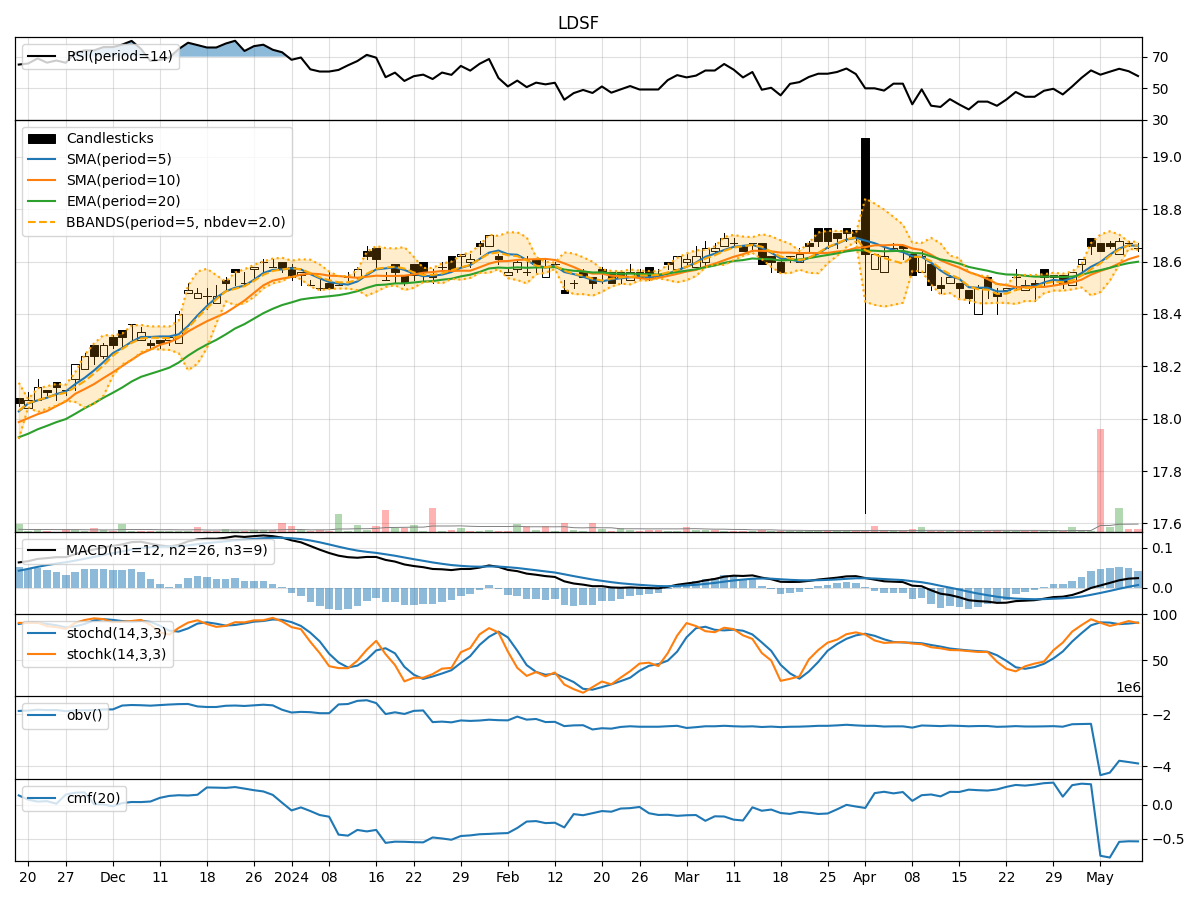
In the last 5 trading days, the stock price of LDSF has shown a slight upward trend, with minor fluctuations in both price and volume. Various technical indicators have been analyzed to provide insights into the potential future movement of the stock price. The trend, momentum, volatility, and volume indicators have been carefully examined to formulate a comprehensive analysis.
Trend Indicators:
- Moving Averages (MA): The 5-day MA has been consistently above the closing price, indicating a short-term uptrend. Both SMA(10) and EMA(20) have shown a gradual increase, supporting the bullish sentiment.
- MACD: The MACD line has been positive and increasing, while the MACD Histogram has shown a slight uptrend, suggesting bullish momentum.
- Conclusion: The trend indicators suggest an upward movement in the stock price.
Momentum Indicators:
- RSI: The RSI has been fluctuating around the overbought territory, indicating strong buying pressure.
- Stochastic Oscillator: Both %K and %D have been in the overbought zone, suggesting a potential reversal.
- Williams %R: The indicator has been hovering in the oversold region, signaling a possible buying opportunity.
- Conclusion: The momentum indicators imply a mixed sentiment, with a slight bias towards a bearish reversal.
Volatility Indicators:
- Bollinger Bands: The stock price has been trading within the bands, with the %B indicating a neutral position.
- Conclusion: Volatility remains stable, with no significant indications of a breakout or breakdown.
Volume Indicators:
- On-Balance Volume (OBV): The OBV has been declining, indicating a divergence between price and volume.
- Chaikin Money Flow (CMF): The CMF has been negative, reflecting selling pressure in the market.
- Conclusion: Volume indicators suggest a bearish sentiment, with decreasing buying interest.
Overall Conclusion:
Based on the analysis of trend, momentum, volatility, and volume indicators, the next few days' possible stock price movement for LDSF is likely to be sideways to slightly bearish. While the trend indicators point towards a potential upward movement, the momentum indicators show signs of a bearish reversal. The stable volatility and bearish volume indicators further support the view of a sideways to slightly bearish price action.
Recommendation:
- Short-term Traders: Consider taking profits or implementing hedging strategies to protect against potential downside risk.
- Long-term Investors: Monitor the price action closely and wait for more clarity before making significant investment decisions.
- Risk Management: Set stop-loss orders and adhere to proper risk management practices to mitigate potential losses in case of a bearish reversal.
Disclaimer:
This analysis is based on technical indicators and historical data, and market conditions can change rapidly. It is essential to conduct thorough research and consider other fundamental factors before making any investment decisions. Consulting with a financial advisor is recommended for personalized investment advice tailored to individual risk tolerance and financial goals.