Technical Analysis of LDUR 2024-05-10
Overview:
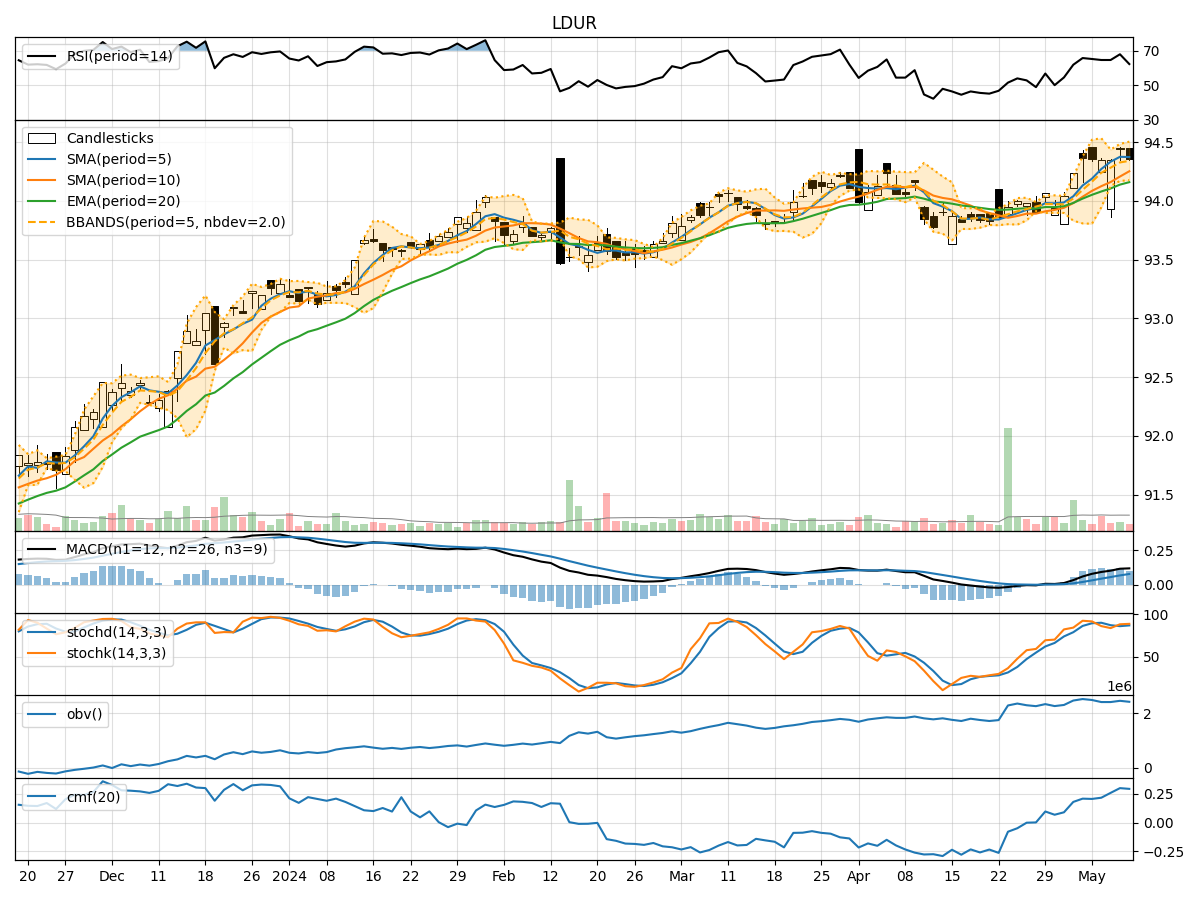
In analyzing the technical indicators for LDUR stock over the last 5 days, we will delve into the trend, momentum, volatility, and volume indicators to provide a comprehensive outlook on the possible stock price movement in the coming days. By examining these key indicators, we aim to offer valuable insights and predictions for potential investors.
Trend Indicators:
- Moving Averages (MA): The 5-day moving average has been consistently above the simple moving average (SMA) and exponential moving average (EMA), indicating a short-term uptrend.
- MACD: The MACD line has been consistently above the signal line, with both lines showing an upward trend, suggesting bullish momentum.
- MACD Histogram: The histogram has been increasing over the past 5 days, indicating strengthening bullish momentum.
Momentum Indicators:
- RSI: The Relative Strength Index (RSI) has been fluctuating around the overbought territory, suggesting a strong bullish momentum.
- Stochastic Oscillator: Both %K and %D lines have been in the overbought zone, indicating a strong bullish momentum.
- Williams %R: The Williams %R has been hovering in the oversold territory, indicating a potential reversal in the bullish momentum.
Volatility Indicators:
- Bollinger Bands: The stock price has been trading within the upper and lower Bollinger Bands, indicating a period of consolidation.
- Bollinger %B: The %B indicator has been fluctuating around the midline, suggesting a lack of clear direction in price movement.
Volume Indicators:
- On-Balance Volume (OBV): The OBV has been showing a slight increase over the last 5 days, indicating some accumulation by investors.
- Chaikin Money Flow (CMF): The CMF has been positive, suggesting that money is flowing into the stock.
Key Observations and Opinions:
- Trend: The trend indicators suggest a bullish sentiment in the short term, supported by the moving averages and MACD.
- Momentum: The momentum indicators indicate a strong bullish momentum, although the Williams %R suggests a potential reversal.
- Volatility: The Bollinger Bands and %B indicator point towards a period of consolidation with no clear trend.
- Volume: The volume indicators show a slight increase in accumulation, supported by the positive CMF.
Conclusion:
Based on the analysis of the technical indicators, the stock price of LDUR is likely to experience further upward movement in the coming days. The bullish trend and momentum, coupled with positive volume indicators, suggest that investors are optimistic about the stock. However, caution should be exercised as the Williams %R indicator hints at a potential reversal in momentum. Overall, the outlook for LDUR stock is bullish in the short term.