Technical Analysis of LEAD 2024-05-10
Overview:
In analyzing the provided technical indicators for the last 5 days, we will delve into the trend, momentum, volatility, and volume indicators to forecast the possible stock price movement for the next few days. By examining these key aspects, we aim to provide a comprehensive and insightful prediction backed by data-driven analysis.
Trend Indicators:
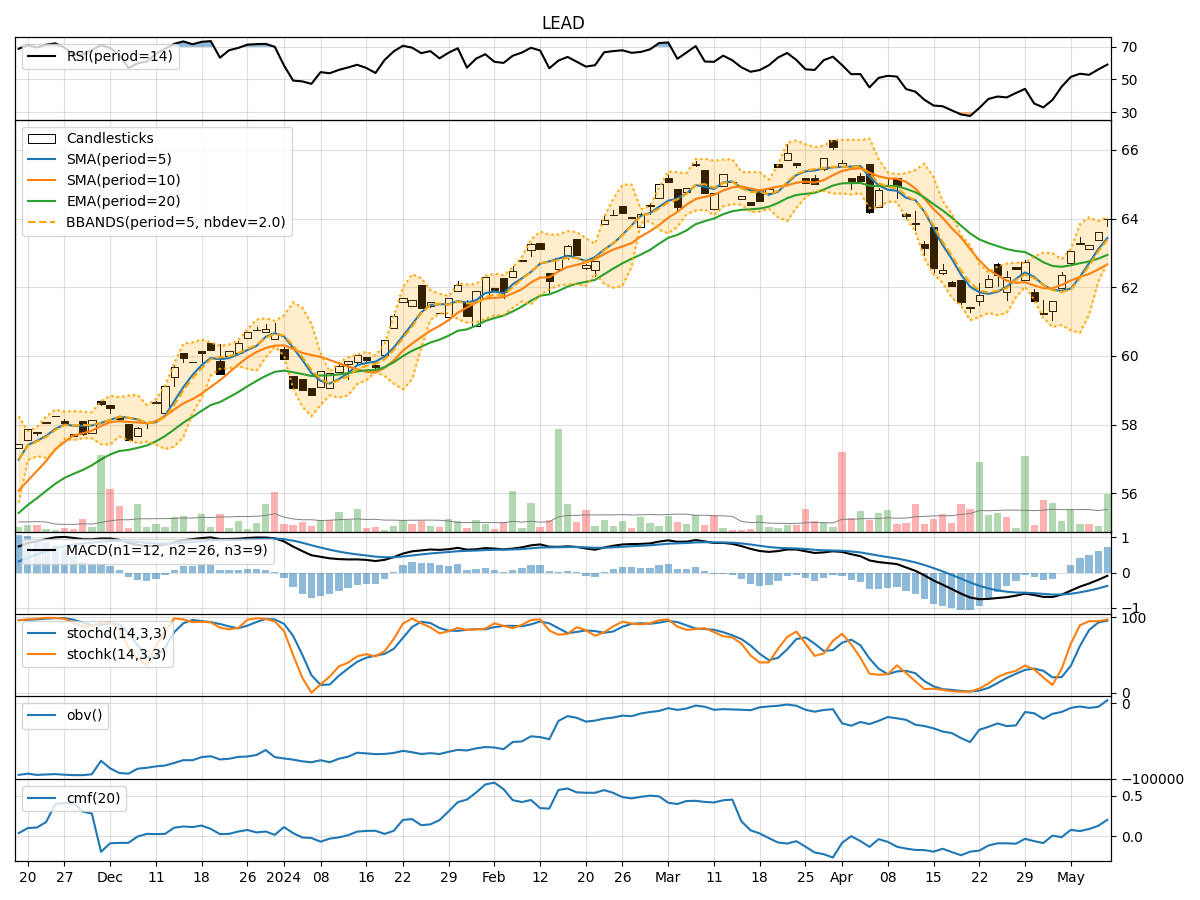
- Moving Averages (MA): The 5-day moving average has been consistently rising, indicating a bullish trend in the short term.
- MACD: The MACD line has been negative but showing signs of convergence towards the signal line, suggesting a potential bullish crossover.
- RSI: The RSI is in the neutral zone, indicating a balanced market sentiment without extreme overbought or oversold conditions.
Momentum Indicators:
- Stochastic Oscillator: Both %K and %D have been in the overbought territory, signaling a strong bullish momentum.
- Williams %R: The Williams %R is hovering around 0, indicating a neutral stance in terms of momentum.
Volatility Indicators:
- Bollinger Bands (BB): The stock price has been trading within the bands, with the upper band acting as a resistance level.
- BB% (BB Percentage): The BB% is relatively high, suggesting increased volatility in the stock price.
Volume Indicators:
- On-Balance Volume (OBV): The OBV has been steadily increasing, indicating strong buying pressure in the market.
- Chaikin Money Flow (CMF): The CMF is positive, reflecting a healthy inflow of money into the stock.
Key Observations and Opinions:
- Trend: The stock is in an upward trend based on the moving averages and MACD convergence.
- Momentum: The momentum indicators suggest a strong bullish sentiment in the market.
- Volatility: The stock is experiencing increased volatility, as indicated by the Bollinger Bands.
- Volume: The volume indicators point towards positive accumulation and buying interest in the stock.
Conclusion:
Based on the analysis of the technical indicators, the next few days are likely to see a continuation of the bullish trend in the stock price. Investors can consider buying opportunities, keeping a close watch on the resistance levels indicated by the Bollinger Bands. It is essential to monitor the MACD crossover and the Stochastic Oscillator for confirmation of the bullish momentum. Overall, the outlook for the stock appears positive with potential for further upside movement.