Technical Analysis of LEMB 2024-05-10
Overview:
In analyzing the technical indicators for LEMB stock over the last 5 days, we will delve into the trend, momentum, volatility, and volume indicators to provide a comprehensive outlook on the possible stock price movement in the coming days. By examining these key indicators, we aim to offer valuable insights and predictions for potential investors.
Trend Analysis:
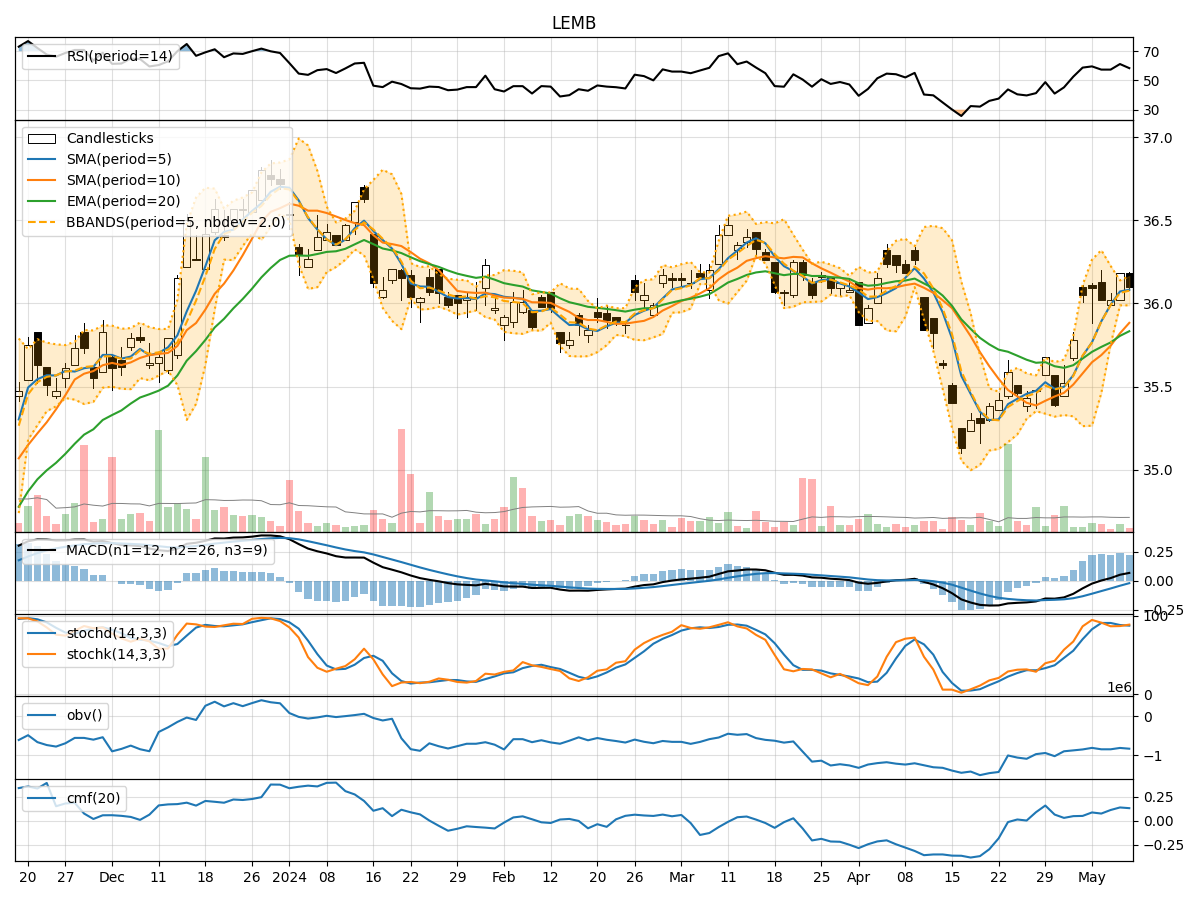
- Moving Averages (MA): The 5-day Moving Average (MA) has been consistently above the Simple Moving Average (SMA) and Exponential Moving Average (EMA), indicating a bullish trend.
- MACD: The MACD line has been consistently above the signal line, with both lines showing an upward trend, suggesting bullish momentum.
- Conclusion: The trend indicators point towards an upward trend in the stock price.
Momentum Analysis:
- RSI: The Relative Strength Index (RSI) has been fluctuating around the 50 level, indicating a neutral momentum.
- Stochastic Oscillator: Both %K and %D have been hovering around the overbought zone, suggesting a potential reversal.
- Conclusion: The momentum indicators suggest a neutral to slightly bearish momentum in the stock.
Volatility Analysis:
- Bollinger Bands (BB): The stock price has been trading within the Bollinger Bands, with the bands narrowing, indicating decreasing volatility.
- Conclusion: The volatility indicators signal a consolidation phase in the stock price.
Volume Analysis:
- On-Balance Volume (OBV): The OBV has been fluctuating, indicating indecision among investors.
- Chaikin Money Flow (CMF): The CMF has been positive, suggesting buying pressure in the stock.
- Conclusion: The volume indicators reflect mixed signals in terms of investor sentiment.
Overall Conclusion:
Based on the analysis of the trend, momentum, volatility, and volume indicators, the following conclusions can be drawn: - The trend indicators suggest an upward trend in the stock price. - Momentum indicators indicate a neutral to slightly bearish momentum. - Volatility indicators point towards a consolidation phase. - Volume indicators show mixed signals in investor sentiment.
Future Price Movement Prediction:
Considering the overall analysis, it is likely that the stock price of LEMB may experience sideways movement in the next few days, with a potential for a slight upward bias due to the bullish trend indicators. However, investors should closely monitor the momentum indicators for any signs of a reversal and exercise caution in their trading decisions.
In conclusion, while the technical indicators provide valuable insights, it is essential to consider other fundamental factors and market dynamics before making investment decisions. Conducting thorough research and consulting with a financial advisor can help in making well-informed investment choices tailored to individual risk tolerance levels and financial goals.