Technical Analysis of LEXI 2024-05-10
Overview:
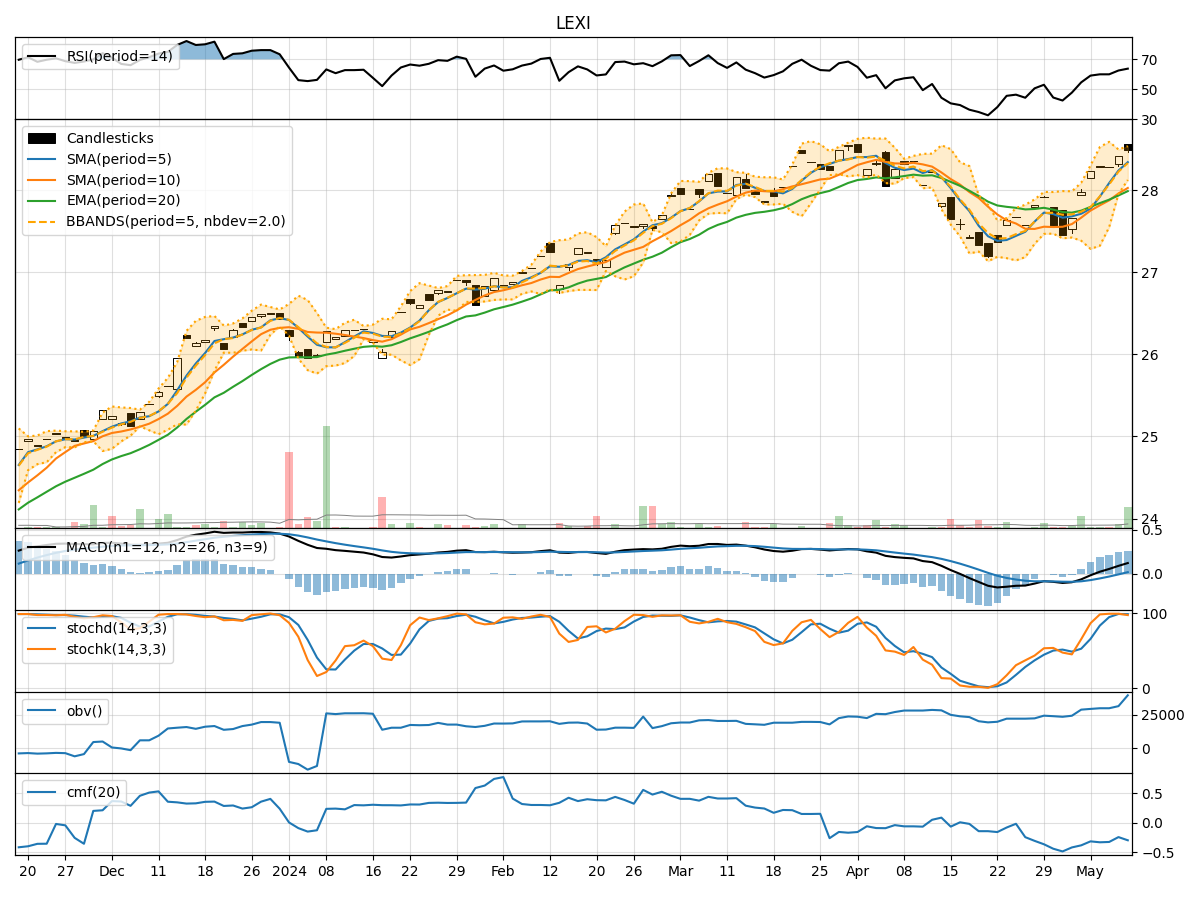
In the last 5 trading days, LEXI stock has shown a consistent uptrend in both price and volume. The moving averages have been trending upwards, indicating a bullish sentiment. Momentum indicators like RSI and Stochastic oscillators suggest the stock is in overbought territory but still showing strength. Volatility indicators like Bollinger Bands show a narrowing range, potentially signaling a period of consolidation. Volume indicators like OBV and CMF reflect mixed sentiment.
Trend Analysis:
- Moving Averages (MA): The 5-day MA has been consistently above the 10-day SMA, indicating a short-term bullish trend. The EMA(20) has been steadily rising, supporting the bullish outlook.
- MACD: The MACD line has been above the signal line for the past 5 days, indicating positive momentum. The MACD histogram has been increasing, suggesting strengthening bullish momentum.
Momentum Analysis:
- RSI: The RSI has been in the overbought zone for the last few days, indicating a strong bullish momentum. However, an overbought RSI could also signal a potential reversal or correction.
- Stochastic Oscillator: Both %K and %D lines have been in the overbought region, suggesting a strong upward momentum. However, being in the overbought zone for an extended period may lead to a reversal.
Volatility Analysis:
- Bollinger Bands (BB): The Bollinger Bands have been narrowing, indicating decreasing volatility and a potential period of consolidation. A breakout from this tightening range could signal the next directional move.
Volume Analysis:
- On-Balance Volume (OBV): The OBV has shown mixed signals, with no clear trend in volume accumulation or distribution. This could suggest indecision among market participants.
- Chaikin Money Flow (CMF): The CMF has been negative, indicating selling pressure. However, the magnitude of the CMF is not significant, suggesting a balanced flow of money in the stock.
Conclusion:
Based on the technical indicators analyzed: - Trend: The stock is in a clear upward trend supported by moving averages and MACD. - Momentum: The momentum indicators suggest a strong bullish sentiment but also hint at potential overbought conditions. - Volatility: The narrowing Bollinger Bands indicate a potential period of consolidation before the next significant move. - Volume: Mixed signals from volume indicators suggest indecisiveness among market participants.
Overall Assessment:
Considering the overall technical analysis, the stock is likely to experience further upward movement in the short term, supported by the bullish trend and momentum. However, caution is advised due to the overbought conditions indicated by the RSI and Stochastic oscillators. Traders should watch for a potential breakout from the tightening Bollinger Bands for confirmation of the next directional move. It is recommended to closely monitor price action and key support/resistance levels for timely decision-making.