Technical Analysis of LFEQ 2024-05-10
Overview:
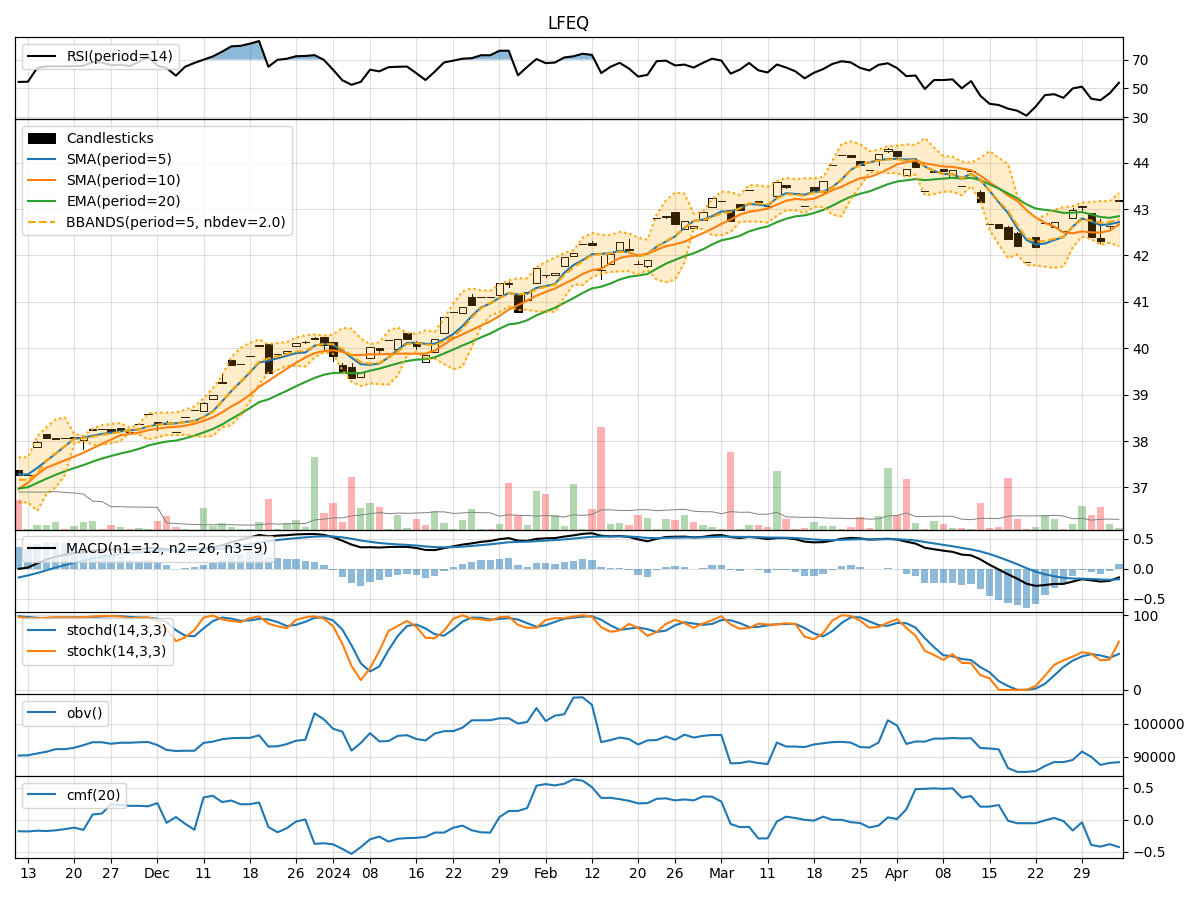
In analyzing the technical indicators for LFEQ over the last 5 days, we will delve into the trend, momentum, volatility, and volume indicators to provide a comprehensive outlook on the possible stock price movement in the coming days.
Trend Indicators:
- Moving Averages (MA): The 5-day MA has been consistently above the closing price, indicating a bullish trend.
- MACD: The MACD line has been above the signal line, suggesting a bullish momentum.
- EMA: The EMA has been trending upwards, supporting the bullish sentiment.
Momentum Indicators:
- RSI: The RSI has been in the neutral zone, indicating neither overbought nor oversold conditions.
- Stochastic Oscillator: Both %K and %D have been at high levels, signaling potential overbought conditions.
- Williams %R: The indicator has been hovering around the oversold territory, suggesting a possible reversal.
Volatility Indicators:
- Bollinger Bands: The bands have been narrowing, indicating decreasing volatility.
- Bollinger %B: The %B has been increasing, suggesting a potential uptrend.
- Average True Range (ATR): The ATR has been decreasing, reflecting lower volatility.
Volume Indicators:
- On-Balance Volume (OBV): The OBV has been fluctuating, indicating mixed buying and selling pressure.
- Chaikin Money Flow (CMF): The CMF has been negative, suggesting outflow of money from the stock.
Key Observations and Opinions:
- Trend: The trend indicators point towards a bullish sentiment with moving averages and MACD supporting an upward trajectory.
- Momentum: The momentum indicators show mixed signals with RSI neutral, Stochastic overbought, and Williams %R oversold, indicating a potential reversal.
- Volatility: Volatility has been decreasing, suggesting a possible period of consolidation or sideways movement.
- Volume: The volume indicators reflect mixed sentiment with OBV fluctuating and CMF negative, indicating uncertainty in market participation.
Conclusion:
Based on the analysis of the technical indicators, the next few days for LFEQ could see sideways movement with a potential for a bullish bias. Traders should closely monitor the momentum indicators for any signs of a reversal and keep an eye on volume patterns for confirmation of the price action. It is advisable to set tight stop-loss levels to manage risk effectively in this uncertain market environment.