Technical Analysis of LGHT 2024-05-10
Overview:
In analyzing the technical indicators for LGHT over the last 5 days, we will delve into the trend, momentum, volatility, and volume indicators to provide a comprehensive outlook on the possible stock price movement in the coming days. By examining these key indicators, we aim to offer valuable insights and recommendations for potential investors.
Trend Indicators:
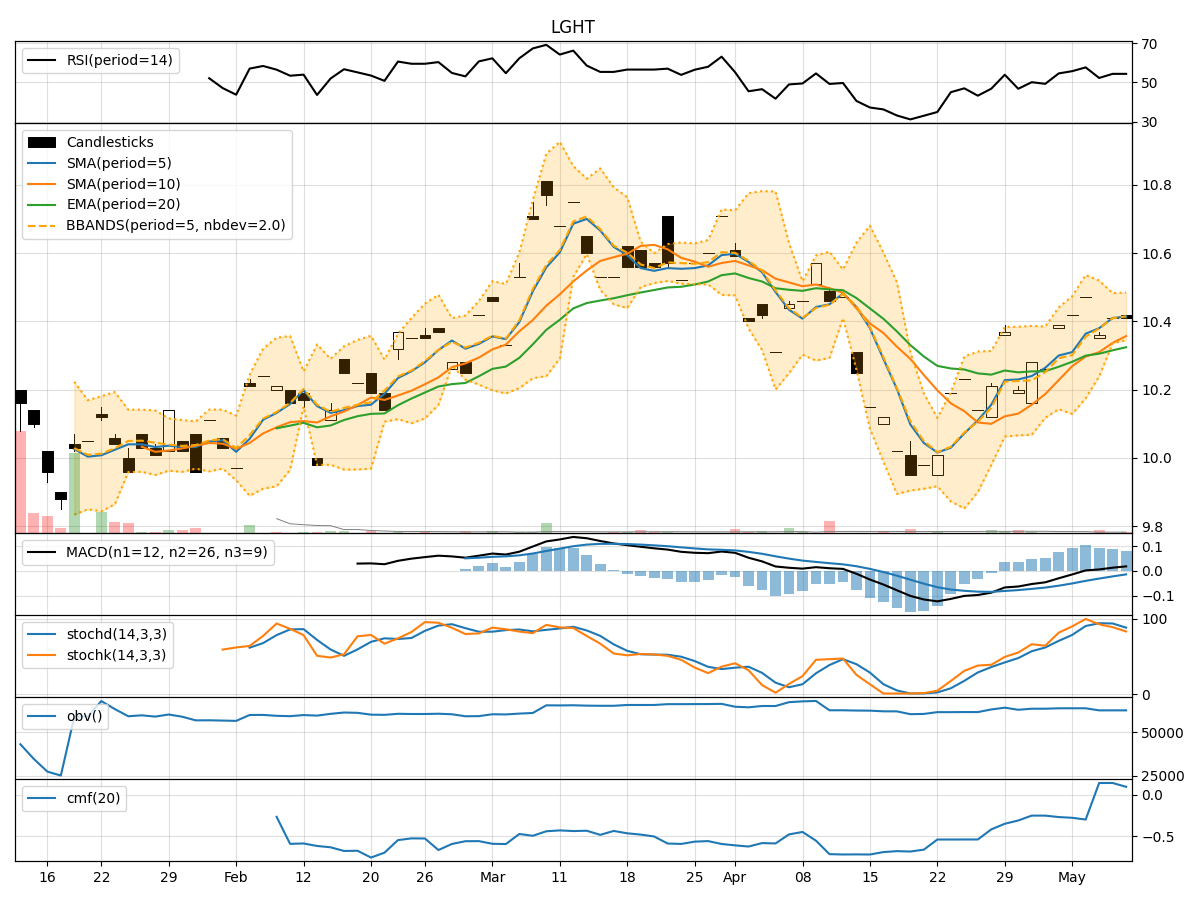
- Moving Averages (MA): The 5-day Moving Average has been consistently above the Simple Moving Average (SMA) and Exponential Moving Average (EMA), indicating a bullish trend.
- MACD: The MACD line has been consistently above the signal line, with both lines showing an upward trend, suggesting bullish momentum.
- MACD Histogram: The MACD Histogram has been consistently above the zero line, indicating increasing bullish momentum.
Momentum Indicators:
- RSI: The Relative Strength Index (RSI) has been fluctuating around the 50 level, indicating a neutral momentum.
- Stochastic Oscillator: Both %K and %D lines of the Stochastic Oscillator have been fluctuating, showing indecision in momentum.
- Williams %R: The Williams %R has been hovering around oversold levels, suggesting a potential reversal in momentum.
Volatility Indicators:
- Bollinger Bands: The stock price has been trading within the Bollinger Bands, with the bands narrowing, indicating decreasing volatility.
- Bollinger %B: The %B indicator has been fluctuating around the 0.5 level, suggesting a balanced volatility level.
Volume Indicators:
- On-Balance Volume (OBV): The OBV has been relatively stable, indicating no significant divergence between price and volume.
- Chaikin Money Flow (CMF): The CMF has been positive, indicating buying pressure in the stock.
Key Observations:
- The trend indicators suggest a strong bullish sentiment in the stock.
- Momentum indicators show mixed signals with a neutral to slightly bearish bias.
- Volatility indicators point towards decreasing volatility in the stock.
- Volume indicators indicate a stable relationship between price and volume.
Conclusion:
Based on the analysis of the technical indicators, the stock of LGHT is currently in an upward trend with strong bullish momentum. However, the mixed signals from momentum indicators and the decreasing volatility suggest a possible consolidation phase in the coming days. Investors should closely monitor key support and resistance levels for potential entry or exit points. Overall, the outlook for LGHT remains bullish in the near term, but caution is advised due to the potential for a consolidation phase.