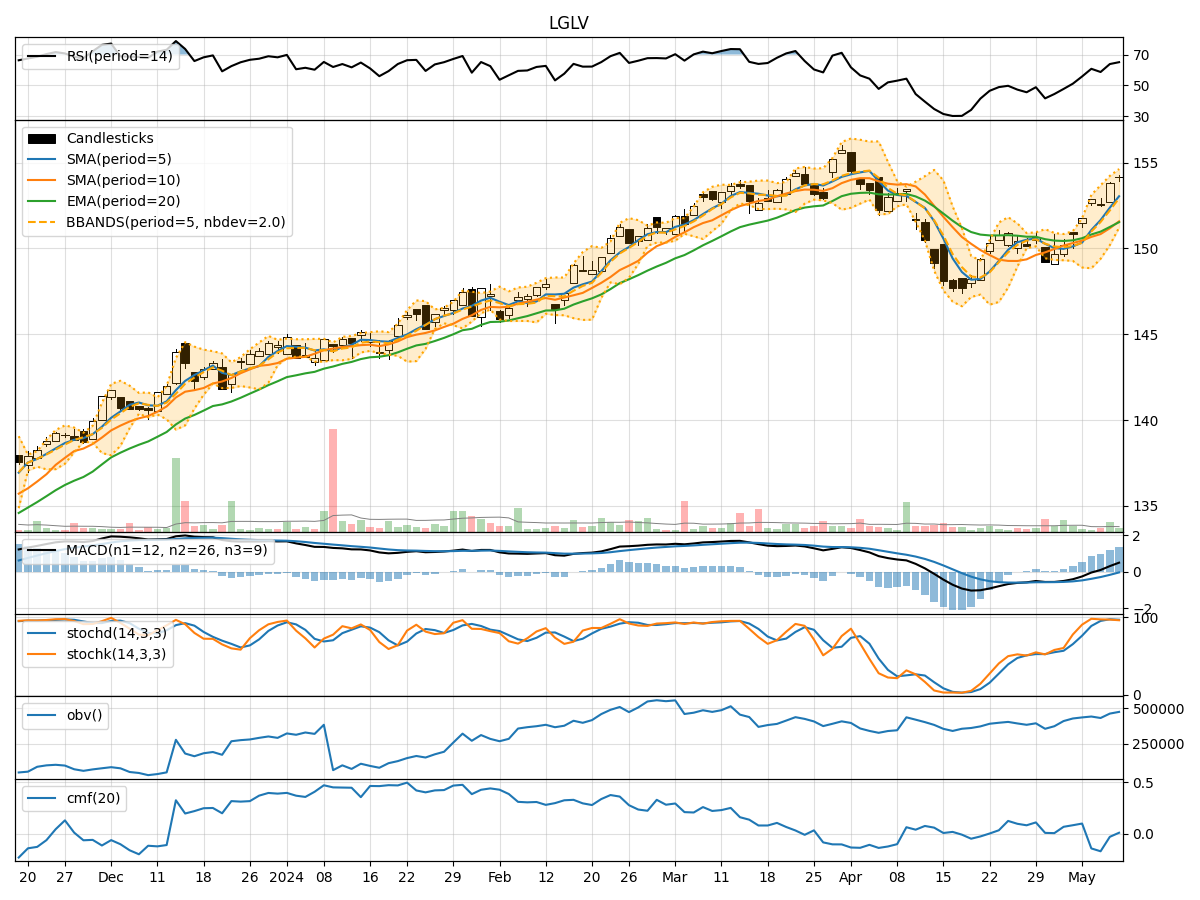
Technical Analysis of LGLV 2024-05-10
Overview:
In analyzing the technical indicators for LGLV over the last 5 days, we will delve into the trend, momentum, volatility, and volume indicators to provide a comprehensive outlook on the possible stock price movement in the coming days.
Trend Analysis:
- Moving Averages (MA): The 5-day Moving Average has been consistently above the Simple Moving Average (SMA) of 10 days, indicating a short-term bullish trend.
- Exponential Moving Average (EMA): The EMA(20) has been steadily increasing, reflecting a positive trend in the stock price.
- MACD: The MACD line has been above the signal line for the past 5 days, suggesting a bullish momentum in the stock.
Momentum Analysis:
- RSI: The Relative Strength Index (RSI) has been trending upwards, indicating increasing buying pressure.
- Stochastic Oscillator: Both %K and %D lines of the Stochastic Oscillator have been in the overbought zone, suggesting a strong bullish momentum.
- Williams %R: The Williams %R has been consistently negative, indicating an oversold condition.
Volatility Analysis:
- Bollinger Bands (BB): The stock price has been trading within the Bollinger Bands, with the bands narrowing, indicating decreasing volatility.
- Bollinger %B: The %B indicator has been hovering around 0.8, suggesting the stock is trading near the upper band.
Volume Analysis:
- On-Balance Volume (OBV): The OBV has shown mixed signals, with fluctuations in volume accumulation.
- Chaikin Money Flow (CMF): The CMF has been negative, indicating distribution in the stock.
Key Observations:
- The trend indicators suggest a bullish sentiment in the stock, supported by the moving averages and MACD.
- Momentum indicators reflect a strong buying pressure with overbought conditions in the Stochastic Oscillator.
- Volatility has been decreasing, indicating a possible consolidation phase.
- Volume indicators show mixed signals with fluctuations in volume accumulation.
Conclusion:
Based on the analysis of the technical indicators, the stock is likely to continue its upward momentum in the coming days. The bullish trend supported by moving averages and MACD, coupled with strong buying pressure indicated by momentum indicators, suggests a potential for further price appreciation. However, caution is advised as the stock is in overbought territory according to the Stochastic Oscillator. The decreasing volatility and mixed volume signals may lead to a period of consolidation before potential further upside. Overall, the outlook for LGLV is bullish with a possibility of consolidation in the short term.