Technical Analysis of LIT 2024-05-10
Overview:
In analyzing the technical indicators for LIT stock over the last 5 days, we will delve into the trend, momentum, volatility, and volume indicators to provide a comprehensive outlook on the possible stock price movement in the coming days. By examining these key indicators, we aim to offer valuable insights and predictions for informed decision-making.
Trend Analysis:
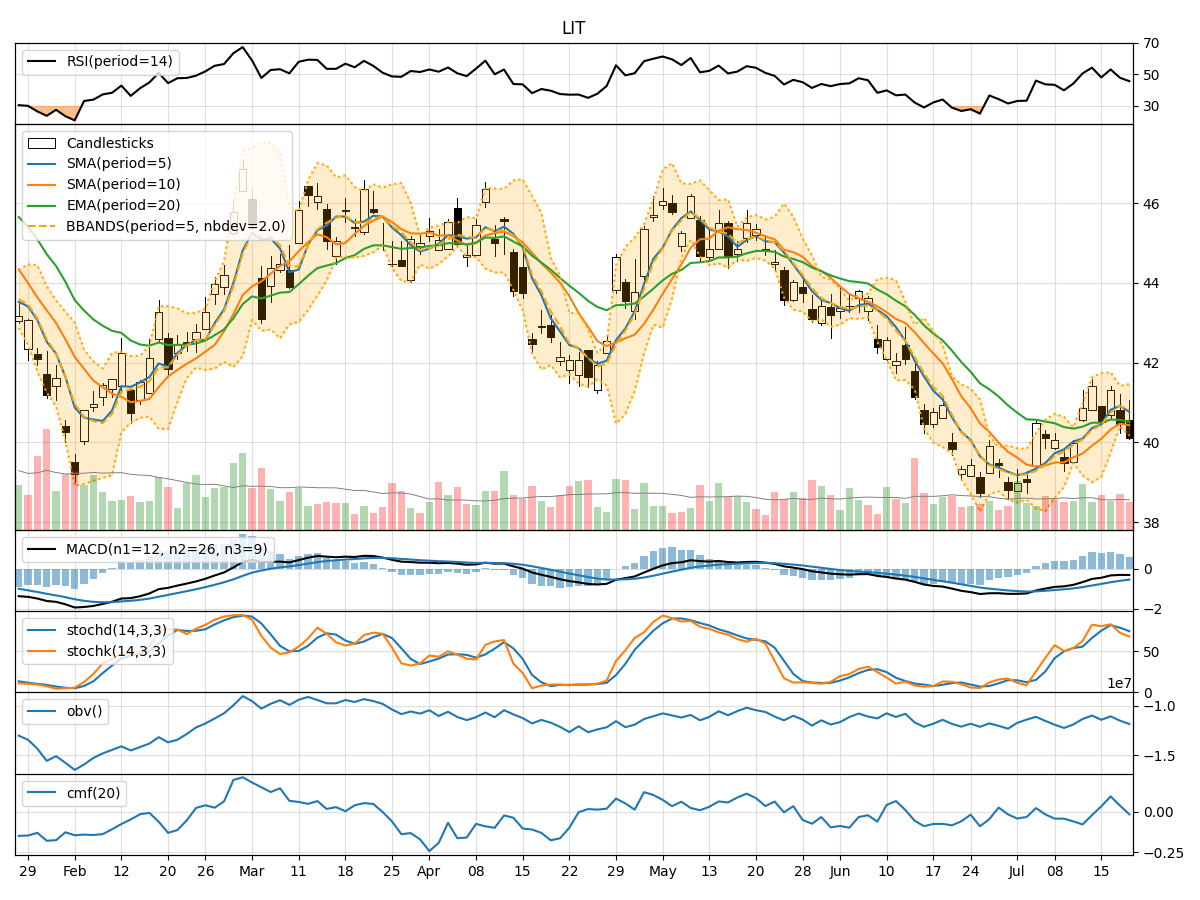
- Moving Averages (MA): The 5-day Moving Average (MA) has been fluctuating around the closing prices, indicating short-term price trends. The Simple Moving Average (SMA) and Exponential Moving Average (EMA) show a gradual increase over the period.
- MACD: The Moving Average Convergence Divergence (MACD) has been positive, suggesting bullish momentum in the stock price.
- Conclusion: The trend indicators point towards an upward trend in the stock price.
Momentum Analysis:
- RSI: The Relative Strength Index (RSI) has been fluctuating but remains above 50, indicating bullish momentum.
- Stochastic Oscillator: Both %K and %D have been decreasing but are still in the overbought zone, suggesting a potential reversal.
- Conclusion: Momentum indicators suggest a mixed sentiment with a slight bearish bias.
Volatility Analysis:
- Bollinger Bands (BB): The stock price has been trading within the Bollinger Bands, with the bands narrowing, indicating decreasing volatility.
- Conclusion: Volatility indicators signal a consolidation phase with a sideways movement expected.
Volume Analysis:
- On-Balance Volume (OBV): The OBV has been fluctuating but shows a slight increase, indicating buying pressure.
- Chaikin Money Flow (CMF): The CMF has been positive, suggesting money flow into the stock.
- Conclusion: Volume indicators point towards positive sentiment and potential upward movement.
Overall Conclusion:
Based on the analysis of trend, momentum, volatility, and volume indicators, the stock price of LIT is likely to experience an upward movement in the coming days. The trend indicators support a bullish sentiment, while volume indicators indicate buying pressure. However, momentum indicators show a mixed sentiment with a slight bearish bias, suggesting potential short-term fluctuations. The volatility indicators signal a consolidation phase with sideways movement expected.
Recommendation:
Considering the overall analysis, it is advisable to monitor the stock closely for any signs of reversal in momentum. Investors may consider buying on dips within the consolidation range for potential upside gains. It is essential to set stop-loss levels to manage risk effectively. Additionally, staying updated on market news and events that may impact the stock price is crucial for making informed decisions.
Disclaimer:
This analysis is based on historical data and technical indicators, and market conditions can change rapidly. It is important to conduct thorough research and consider other fundamental factors before making investment decisions. Consulting with a financial advisor is recommended to align investment strategies with individual goals and risk tolerance levels.