Technical Analysis of LITP 2024-05-10
Overview:
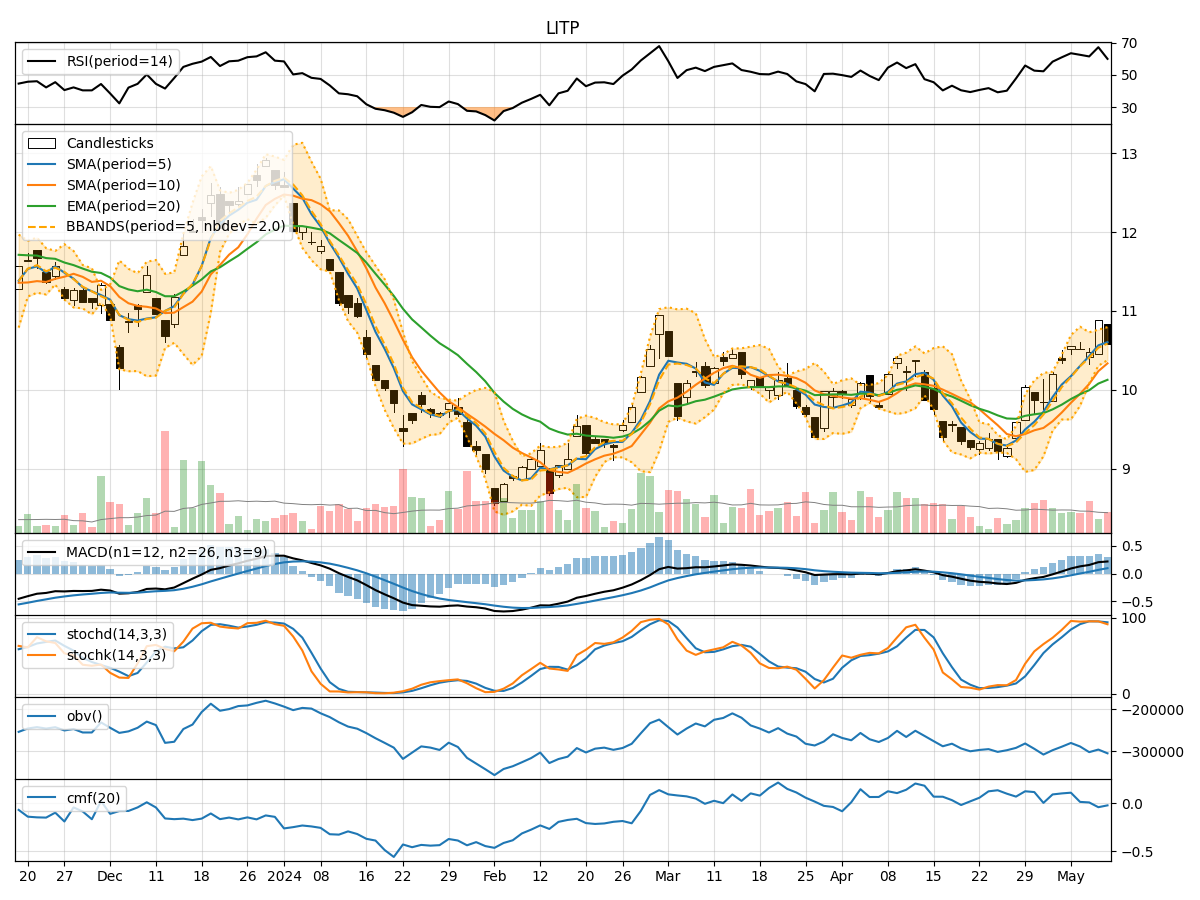
In analyzing the technical indicators for LITP over the last 5 days, we will delve into the trend, momentum, volatility, and volume indicators to provide a comprehensive outlook on the possible stock price movement in the coming days. By examining key metrics such as moving averages, MACD, RSI, Bollinger Bands, and OBV, we aim to offer valuable insights and predictions for informed decision-making.
Trend Indicators:
- Moving Averages (MA): The 5-day MA has been consistently above the closing price, indicating a bullish trend.
- MACD: The MACD line has been above the signal line, suggesting a bullish momentum.
- EMA: The EMA has been trending upwards, supporting the bullish sentiment.
Momentum Indicators:
- RSI: The RSI has been fluctuating but generally staying within the neutral to slightly overbought territory.
- Stochastic Oscillator: Both %K and %D have been relatively high, indicating bullish momentum.
- Williams %R: The indicator has shown oversold conditions on some days but has not consistently signaled a clear direction.
Volatility Indicators:
- Bollinger Bands: The stock price has mostly stayed within the bands, with occasional breaches, suggesting moderate volatility.
- Bollinger %B: The %B indicator has fluctuated within a moderate range, indicating no extreme overbought or oversold conditions.
Volume Indicators:
- On-Balance Volume (OBV): The OBV has shown mixed signals, with some days seeing accumulation and others distribution.
- Chaikin Money Flow (CMF): The CMF has been mostly positive, indicating buying pressure in the stock.
Key Observations and Opinions:
- Trend: The stock is in an upward trend supported by moving averages and MACD.
- Momentum: Momentum indicators suggest bullish sentiment with occasional overbought conditions.
- Volatility: Volatility is moderate, with the stock price mostly contained within Bollinger Bands.
- Volume: Volume indicators show mixed signals, with slight accumulation indicated by OBV and CMF.
Conclusion:
Based on the analysis of the technical indicators, the next few days for LITP are likely to see a continuation of the upward trend with moderate volatility. Momentum remains bullish, supported by moving averages and MACD. Traders and investors may consider buying opportunities on pullbacks within the overall bullish trend. However, it is essential to monitor key support and resistance levels for potential trend reversals.