Technical Analysis of LJAN 2024-05-10
Overview:
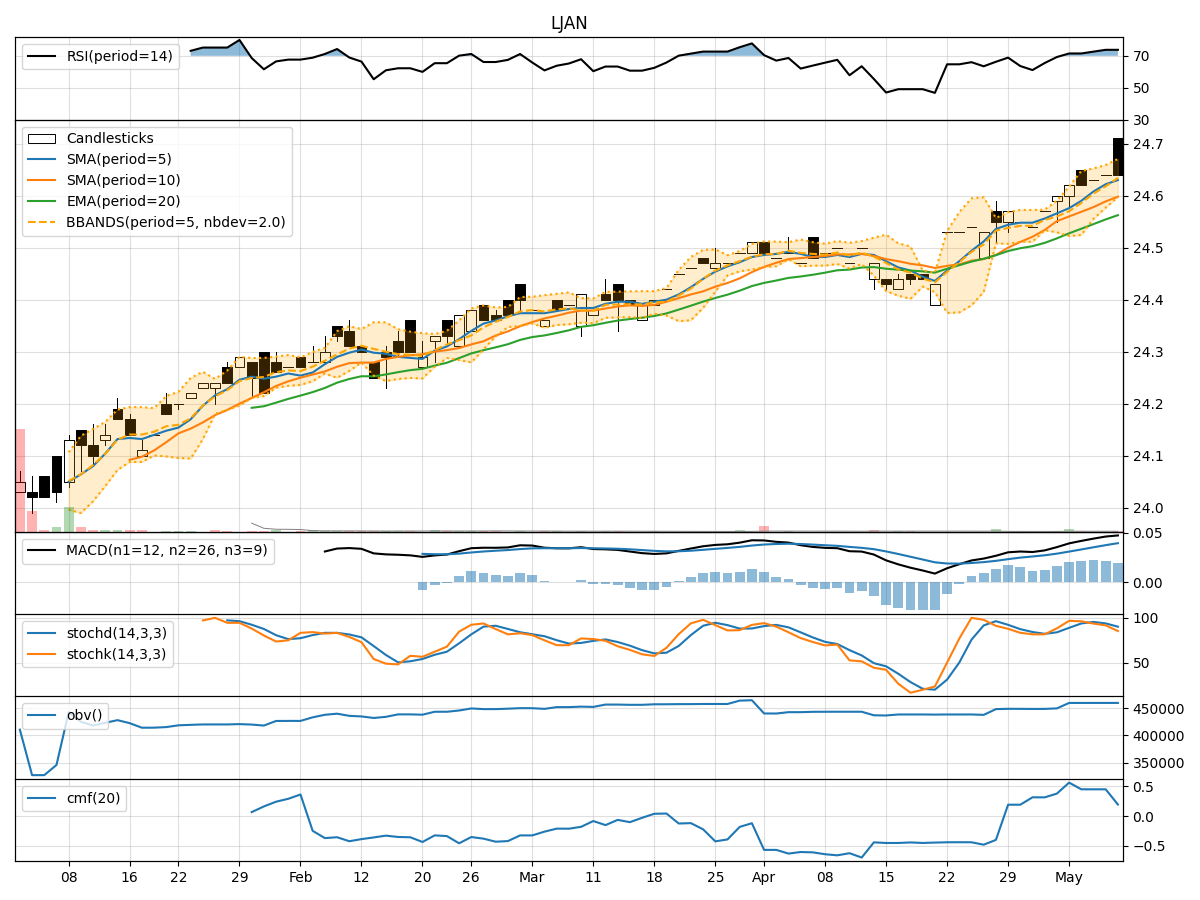
In the last 5 trading days, LJAN stock has shown a consistent uptrend based on various technical indicators. The moving averages, MACD, RSI, and Stochastic indicators all suggest a bullish sentiment. However, the stock has also reached overbought levels, indicating a potential reversal or consolidation phase. Volatility has been relatively low, and volume has been stable.
Trend Indicators:
- Moving Averages (MA): The 5-day MA has been consistently above the 10-day SMA, indicating a short-term bullish trend. The EMA(20) has been steadily increasing, supporting the bullish momentum.
- MACD: The MACD line has been above the signal line, indicating a bullish trend. The MACD histogram has been positive, suggesting upward momentum.
Momentum Indicators:
- RSI: The RSI has been in the overbought territory, indicating a strong bullish momentum. However, this could also signal a potential reversal or correction in the near future.
- Stochastic Oscillator: Both %K and %D lines have been in the overbought zone, suggesting a potential reversal. The Williams %R indicator also indicates an overbought condition.
Volatility Indicators:
- Bollinger Bands (BB): The stock price has been trading within the upper Bollinger Band, indicating an overbought condition. The bands are relatively tight, suggesting low volatility.
Volume Indicators:
- On-Balance Volume (OBV): The OBV has been relatively flat, indicating stable volume flow. This could suggest a lack of strong buying or selling pressure.
- Chaikin Money Flow (CMF): The CMF has been positive, indicating buying pressure. However, the recent decrease in CMF could signal weakening buying momentum.
Key Observations:
- The stock is currently in a strong uptrend, supported by various technical indicators.
- Overbought conditions in RSI and Stochastic indicators suggest a potential reversal or correction.
- Low volatility and stable volume indicate a lack of significant market interest or participation.
Conclusion:
Based on the technical analysis of LJAN stock, the next few days could see a potential consolidation or pullback. The overbought conditions in RSI and Stochastic indicators, along with the stock trading at the upper Bollinger Band, suggest a possible downward correction. Traders should be cautious and consider taking profits or implementing risk management strategies in anticipation of a short-term bearish movement.