Technical Analysis of LMBS 2024-05-10
Overview:
In analyzing the technical indicators for LMBS over the last 5 days, we will delve into the trend, momentum, volatility, and volume indicators to provide a comprehensive outlook on the possible stock price movement. By examining these key factors, we aim to offer valuable insights and predictions for the upcoming days.
Trend Analysis:
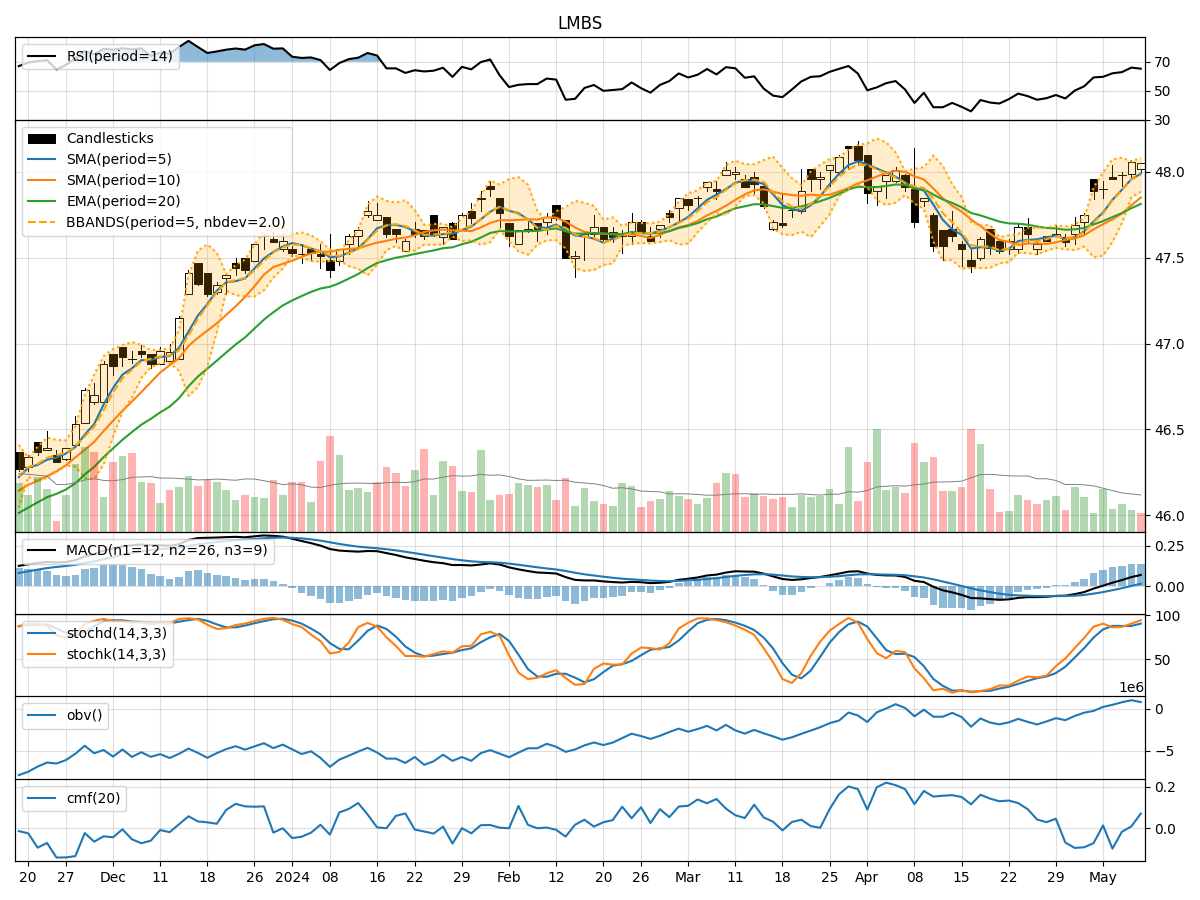
- Moving Averages (MA): The 5-day MA has been consistently above the closing prices, indicating a short-term uptrend.
- MACD: The MACD line has been above the signal line, suggesting bullish momentum.
- RSI: The RSI values have been in the range of 50-70, indicating a moderate bullish sentiment.
Key Observation: The trend indicators suggest a bullish outlook for LMBS in the short term.
Momentum Analysis:
- Stochastic Oscillator: Both %K and %D values have been in the overbought territory, signaling potential price reversal.
- Williams %R: The values have been consistently negative, indicating an oversold condition.
Key Observation: Momentum indicators suggest a possible correction or consolidation in the near future.
Volatility Analysis:
- Bollinger Bands: The price has mostly stayed within the bands, with the %B indicator fluctuating around 0.5.
- Average True Range (ATR): ATR values have been relatively stable, indicating consistent price movement.
Key Observation: Volatility indicators suggest a stable price movement with no significant spikes expected.
Volume Analysis:
- On-Balance Volume (OBV): The OBV has shown a slight increase, indicating accumulation by investors.
- Chaikin Money Flow (CMF): The CMF values have been mixed, reflecting indecision in the market sentiment.
Key Observation: Volume indicators suggest a neutral stance with a slight bias towards accumulation.
Conclusion:
Based on the analysis of trend, momentum, volatility, and volume indicators, the overall outlook for LMBS in the next few days is neutral with a slight bullish bias. While the trend indicators point towards a bullish sentiment, the momentum indicators suggest a potential correction or consolidation. Volatility indicators indicate stable price movement, and volume indicators show a mild accumulation trend.
Key Conclusion: The stock price of LMBS is likely to experience sideways movement with a slight upward bias in the upcoming days. Traders should closely monitor key support and resistance levels for potential entry and exit points.
Remember, market conditions can change rapidly, so it's essential to stay updated with real-time data and adjust your trading strategy accordingly.