Technical Analysis of LNGZ 2024-05-10
Overview:
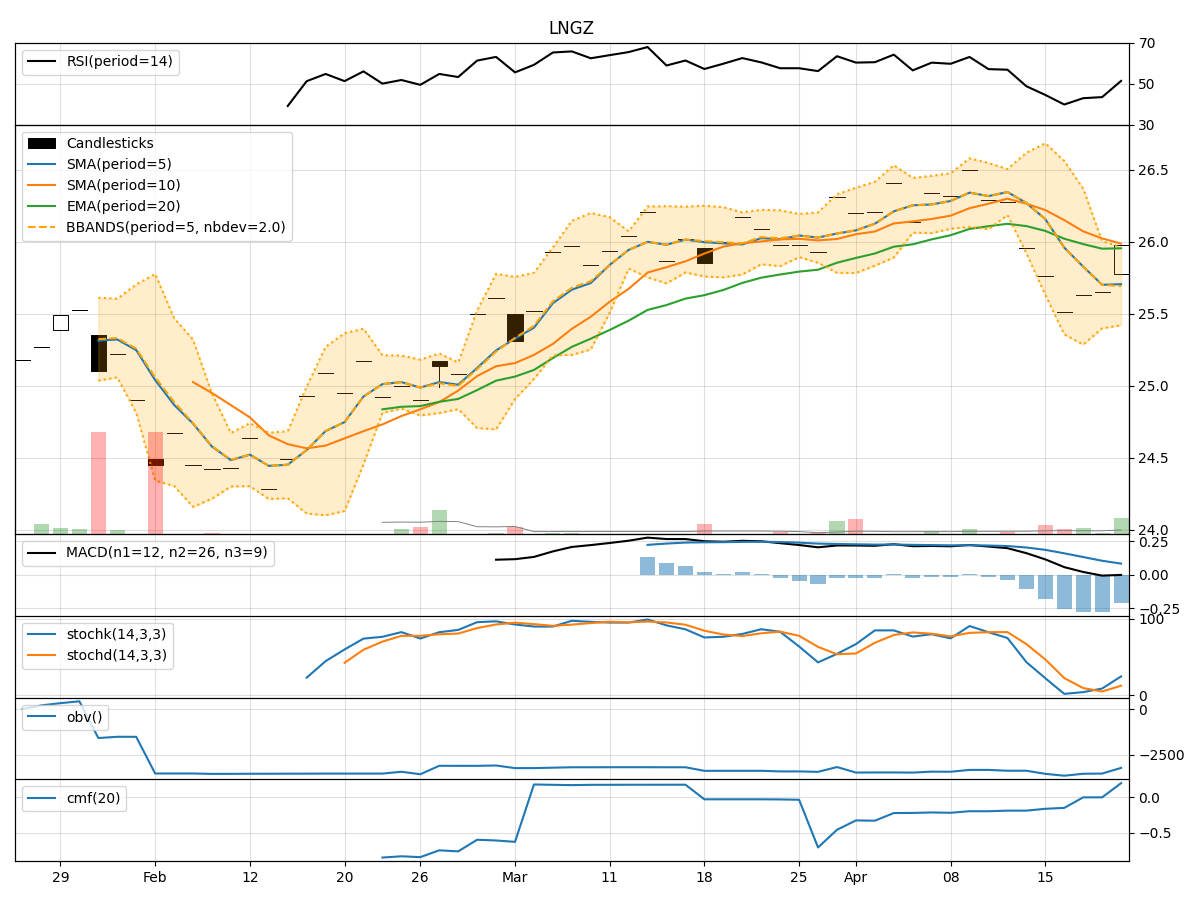
In analyzing the technical indicators for LNGZ over the last 5 days, we will delve into the trend, momentum, volatility, and volume indicators to provide a comprehensive outlook on the possible stock price movement in the coming days.
Trend Indicators:
- Moving Averages (MA): The 5-day MA has been consistently above the closing prices, indicating a short-term uptrend.
- MACD: The MACD line has been above the signal line, suggesting bullish momentum.
- EMA: The EMA has been trending upwards, supporting the bullish sentiment.
Momentum Indicators:
- RSI: The RSI has been in the neutral to slightly overbought territory, indicating potential strength in the current uptrend.
- Stochastic Oscillator: Both %K and %D have been near or at 100, signaling strong buying pressure.
- Williams %R: The indicator has been hovering around oversold levels, potentially signaling a reversal.
Volatility Indicators:
- Bollinger Bands: The stock price has been trading within the bands, with the upper band acting as resistance.
- Bollinger %B: The %B indicator has been fluctuating within a range, suggesting consolidation.
- Average True Range (ATR): The ATR has shown moderate volatility in the stock price.
Volume Indicators:
- On-Balance Volume (OBV): The OBV has been relatively flat, indicating a balance between buying and selling pressure.
- Chaikin Money Flow (CMF): The CMF has been positive, reflecting buying pressure in the stock.
Key Observations:
- The trend indicators suggest a bullish bias with moving averages and MACD supporting an uptrend.
- Momentum indicators indicate strong buying pressure, although Williams %R signals a potential reversal.
- Volatility indicators show moderate price fluctuations within Bollinger Bands.
- Volume indicators reflect a balanced accumulation/distribution of the stock.
Conclusion:
Based on the analysis of the technical indicators, the stock price of LNGZ is likely to continue its upward momentum in the next few days. The trend is bullish, supported by moving averages and MACD, while momentum indicators signal strong buying pressure. Although there might be some short-term consolidation indicated by Williams %R, overall, the outlook remains positive. Traders and investors could consider buying opportunities on pullbacks to capitalize on the expected upward movement.