Technical Analysis of LOPP 2024-05-10
Overview:
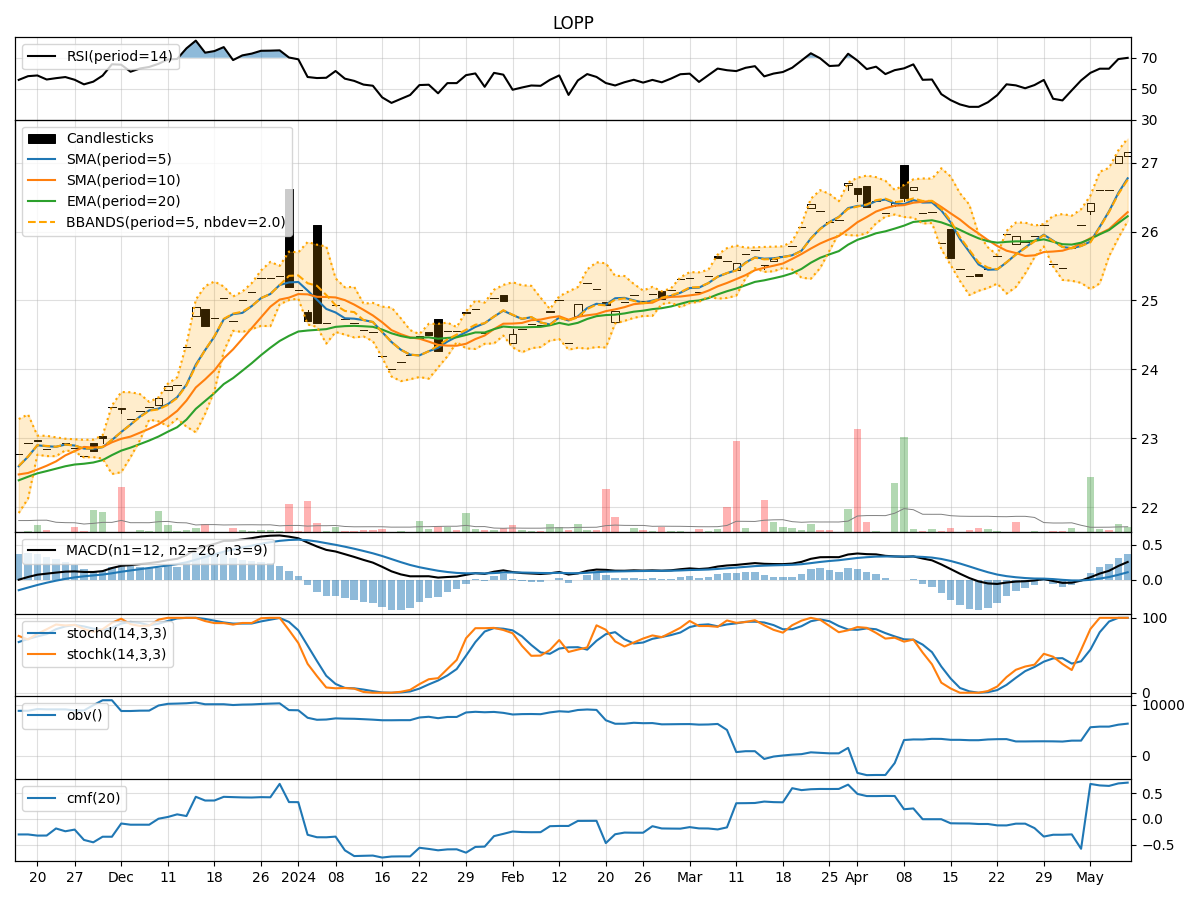
In analyzing the technical indicators for LOPP stock over the last 5 days, we will delve into the trends, momentum, volatility, and volume aspects to provide a comprehensive outlook on the possible stock price movement in the coming days. By examining key indicators such as moving averages, MACD, RSI, Bollinger Bands, and OBV, we aim to offer valuable insights and predictions for potential price action.
Trend Analysis:
- Moving Averages (MA): The 5-day MA has been consistently above the closing prices, indicating a short-term uptrend.
- MACD: The MACD line has been positive and increasing, suggesting bullish momentum.
- EMA: The EMA has been trending upwards, supporting the bullish sentiment.
Momentum Analysis:
- RSI: The RSI has been in the overbought territory, indicating strong buying momentum.
- Stochastic Oscillator: Both %K and %D have been at 100%, signaling strong upward momentum.
- Williams %R: The indicator has consistently been at 0, reflecting a strong bullish sentiment.
Volatility Analysis:
- Bollinger Bands (BB): The bands have been widening, indicating increased volatility.
- BB %B: The %B has been fluctuating within a range, suggesting potential price swings.
Volume Analysis:
- On-Balance Volume (OBV): The OBV has been negative, indicating distribution.
- Chaikin Money Flow (CMF): The CMF has been positive, reflecting buying pressure.
Key Observations:
- The stock is currently in a strong uptrend based on moving averages and MACD.
- Momentum indicators like RSI and Stochastic Oscillator suggest strong buying momentum.
- Volatility has been increasing, potentially leading to larger price movements.
- Volume indicators show mixed signals with OBV negative but CMF positive.
Conclusion:
Based on the analysis of technical indicators, the stock is likely to continue its upward momentum in the coming days. The strong trend, positive momentum, and increasing volatility point towards further price appreciation. Traders and investors can consider buying opportunities in line with the bullish outlook. However, it is essential to monitor the indicators closely for any signs of reversal or consolidation.