Technical Analysis of LOUP 2024-05-10
Overview:
In analyzing the technical indicators for LOUP stock over the last 5 days, we will delve into the trend, momentum, volatility, and volume indicators to provide a comprehensive outlook on the possible stock price movement in the coming days. By examining these key aspects, we aim to offer valuable insights and predictions to guide investment decisions.
Trend Analysis:
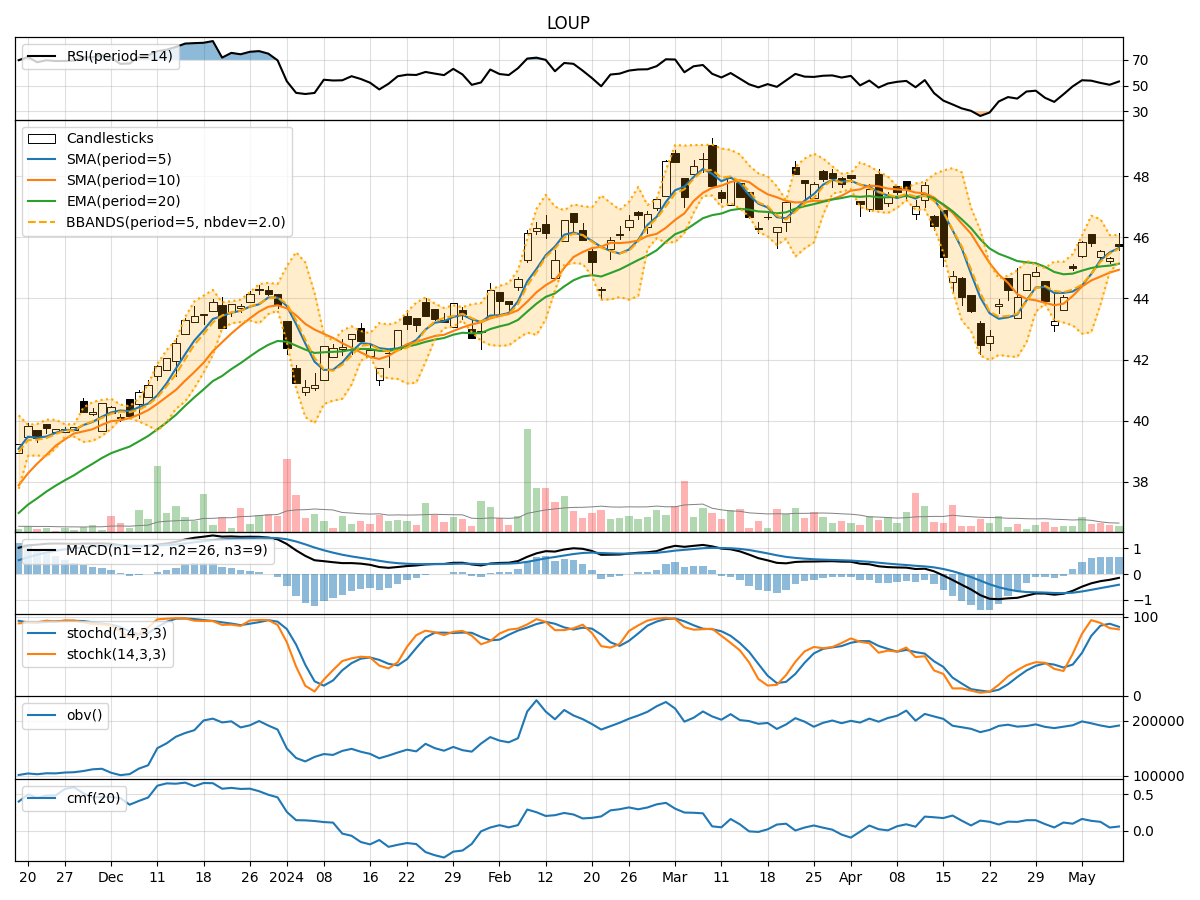
- Moving Averages (MA): The 5-day Moving Average (MA) has been consistently above the Simple Moving Average (SMA) and Exponential Moving Average (EMA), indicating a bullish trend.
- MACD: The MACD line has been negative but converging towards the signal line, suggesting a potential reversal in the bearish momentum.
- RSI: The Relative Strength Index (RSI) has been fluctuating around the neutral zone, indicating a lack of strong trend direction.
Momentum Analysis:
- Stochastic Oscillator: The Stochastic Oscillator shows a downward trend, with both %K and %D values decreasing, signaling potential bearish momentum.
- Williams %R: The Williams %R indicator has been hovering in the oversold territory, suggesting a possible reversal or consolidation phase.
Volatility Analysis:
- Bollinger Bands: The Bollinger Bands have been narrowing, indicating decreasing volatility and a potential breakout or significant price movement ahead.
- Average True Range (ATR): The ATR values have been relatively stable, suggesting consistent price movements without extreme fluctuations.
Volume Analysis:
- On-Balance Volume (OBV): The OBV has been fluctuating, indicating mixed buying and selling pressure in the market.
- Chaikin Money Flow (CMF): The CMF has been positive but relatively low, suggesting moderate buying pressure.
Key Observations:
- The trend indicators point towards a potential reversal in the bearish trend, supported by the convergence of MACD lines.
- Momentum indicators indicate a bearish bias in the short term, with the Stochastic Oscillator showing downward momentum.
- Volatility indicators suggest a potential breakout or significant price movement due to the narrowing Bollinger Bands.
- Volume indicators reflect mixed market sentiment, with no clear dominance of buying or selling pressure.
Conclusion:
Based on the analysis of the technical indicators, the next few days for LOUP stock may see sideways consolidation with a slight bearish bias in the short term. Traders should exercise caution and closely monitor key levels, especially considering the potential breakout indicated by the Bollinger Bands. It is advisable to wait for more clarity in trend direction before making significant trading decisions.