Technical Analysis of LQAI 2024-05-10
Overview:
In analyzing the technical indicators for LQAI over the last 5 days, we will delve into the trend, momentum, volatility, and volume indicators to provide a comprehensive outlook on the possible stock price movement in the coming days. By examining these key indicators, we aim to offer valuable insights and predictions for potential investors.
Trend Indicators:
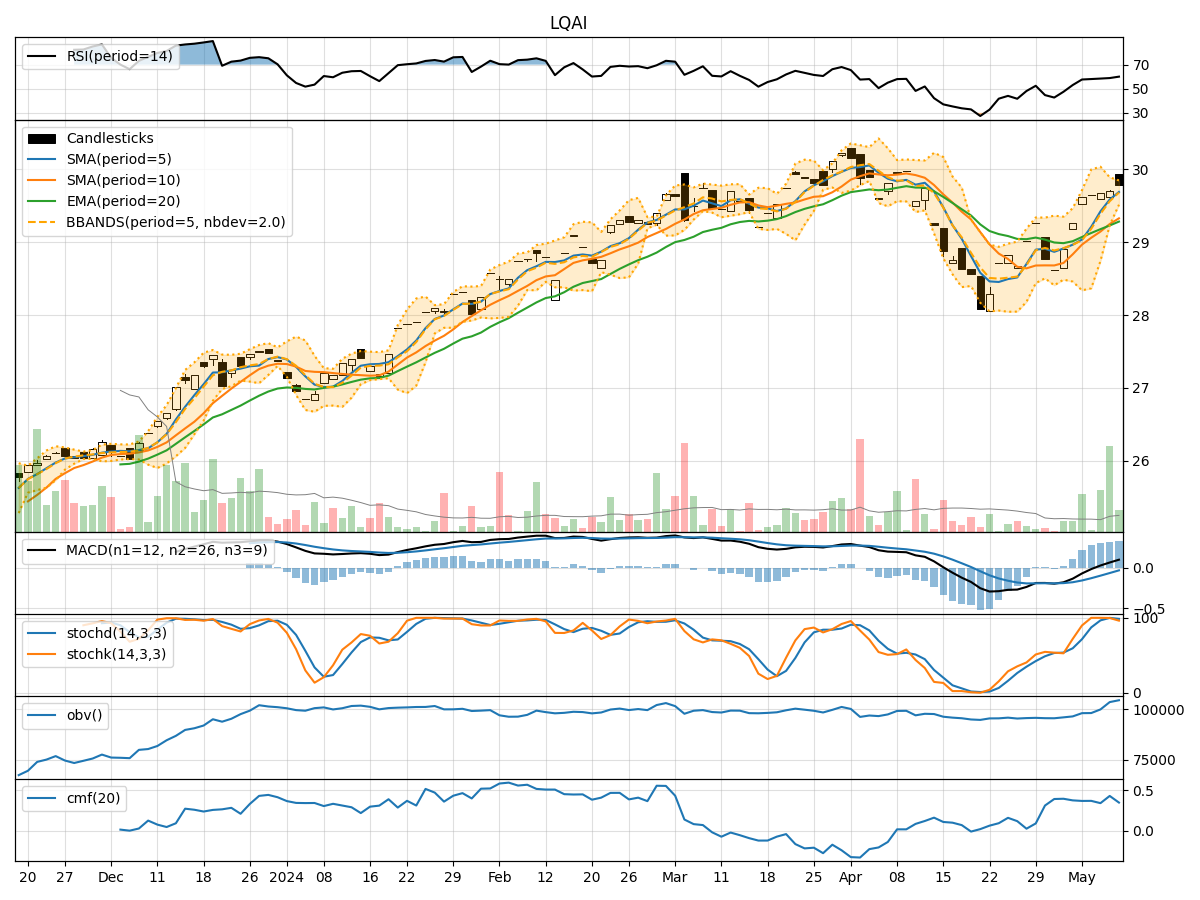
- Moving Averages (MA): The 5-day moving average has been consistently above the simple moving average (SMA) and exponential moving average (EMA), indicating a bullish trend.
- MACD: The MACD line has been consistently above the signal line, with both lines showing an upward trend, suggesting bullish momentum.
- MACD Histogram: The histogram has been increasing over the past 5 days, indicating strengthening bullish momentum.
Momentum Indicators:
- RSI: The Relative Strength Index (RSI) has been gradually increasing and is currently in the overbought territory, signaling a strong bullish momentum.
- Stochastic Oscillator: Both %K and %D lines have been in the overbought zone, indicating a strong bullish momentum.
- Williams %R: The indicator has been consistently in the oversold territory, suggesting a strong bullish sentiment.
Volatility Indicators:
- Bollinger Bands: The stock price has been trading within the upper Bollinger Band, indicating an overbought condition and potential for a pullback.
- Bollinger %B: The %B indicator has been above 0.8, suggesting a high volatility period.
Volume Indicators:
- On-Balance Volume (OBV): The OBV has been increasing over the last 5 days, indicating strong buying pressure.
- Chaikin Money Flow (CMF): The CMF has been positive, indicating that money is flowing into the stock.
Conclusion:
Based on the analysis of the technical indicators, the stock of LQAI is currently exhibiting strong bullish momentum across various indicators. The trend is bullish, supported by moving averages and MACD. Momentum indicators like RSI and Stochastic Oscillator also suggest a strong bullish sentiment. However, the stock is currently in the overbought territory based on volatility indicators like Bollinger Bands.
Forecast:
Given the current technical setup, it is likely that the stock price of LQAI may experience a short-term pullback or consolidation in the coming days due to the overbought conditions indicated by the volatility indicators. Traders should be cautious of a potential correction before considering further long positions.