Technical Analysis of LQDI 2024-05-10
Overview:
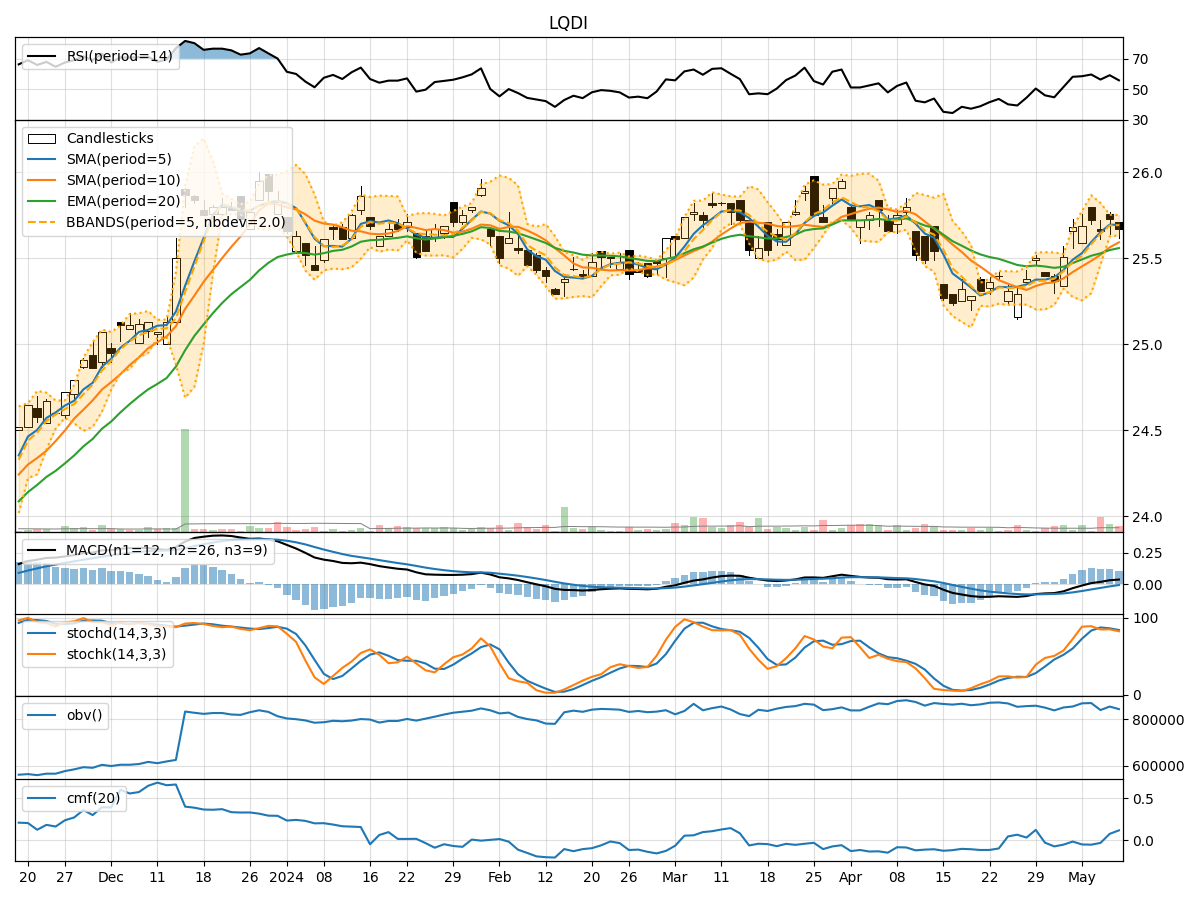
In analyzing the technical indicators for LQDI over the last 5 days, we will delve into the trend, momentum, volatility, and volume indicators to provide a comprehensive outlook on the possible stock price movement in the coming days. By examining these key indicators, we aim to offer valuable insights and predictions for potential investors.
Trend Analysis:
- Moving Averages (MA): The 5-day MA has been consistently above the closing price, indicating a short-term uptrend.
- MACD: The MACD line has been consistently above the signal line, suggesting a bullish momentum.
- EMA: The EMA has been trending upwards, supporting the bullish sentiment in the short to medium term.
Key Observation: The trend indicators point towards a bullish outlook for LQDI in the near future.
Momentum Analysis:
- RSI: The RSI has been fluctuating around the 50 level, indicating a neutral momentum.
- Stochastic Oscillator: Both %K and %D have been hovering around the overbought territory, suggesting a potential reversal.
- Williams %R: The indicator has been in the oversold region, signaling a possible buying opportunity.
Key Observation: The momentum indicators suggest a neutral to slightly bearish momentum for LQDI.
Volatility Analysis:
- Bollinger Bands (BB): The stock price has been trading within the bands, indicating a period of consolidation.
- Bollinger Band Width (BBW): The BBW has been narrowing, suggesting a decrease in volatility.
- Bollinger Band %B (BBP): The %B indicator has been fluctuating around the midline, reflecting a balanced market sentiment.
Key Observation: The volatility indicators imply a sideways movement with reduced volatility in the upcoming sessions.
Volume Analysis:
- On-Balance Volume (OBV): The OBV has shown mixed signals, reflecting indecision among market participants.
- Chaikin Money Flow (CMF): The CMF has been negative, indicating selling pressure in the market.
Key Observation: The volume indicators point towards a neutral to slightly bearish sentiment in terms of trading volume.
Conclusion:
Based on the analysis of the trend, momentum, volatility, and volume indicators, the overall outlook for LQDI in the next few days is as follows: - Trend: Upward - Momentum: Neutral to slightly bearish - Volatility: Sideways - Volume: Neutral to slightly bearish
Final Verdict:
Considering the mixed signals from the various technical indicators, it is likely that LQDI will experience sideways movement with a slight bearish bias in the next few days. Investors should exercise caution and closely monitor key support and resistance levels for potential trading opportunities.