Technical Analysis of LQIG 2024-05-10
Overview:
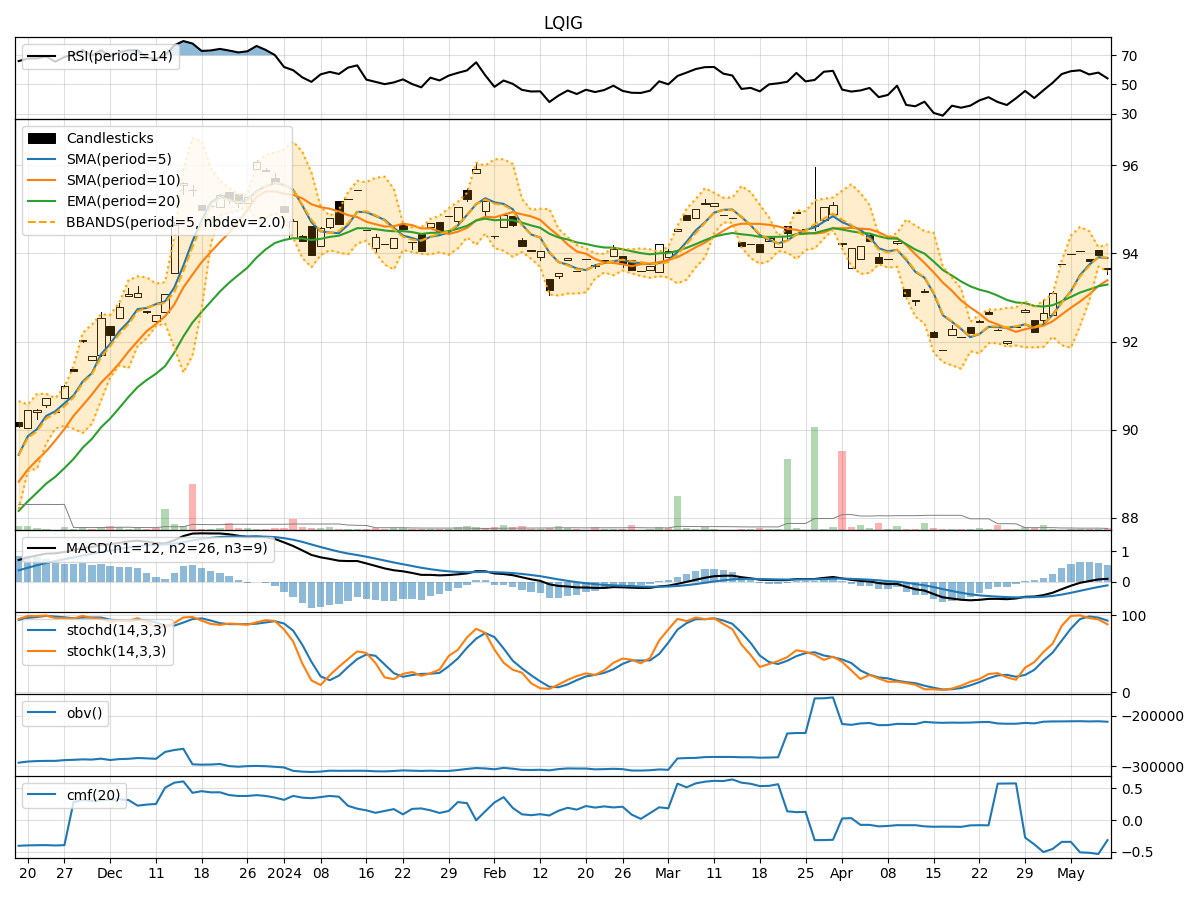
In analyzing the technical indicators for LQIG over the last 5 days, we will delve into the trends, momentum, volatility, and volume aspects to provide a comprehensive outlook on the possible stock price movement. By examining key indicators such as moving averages, MACD, RSI, Bollinger Bands, and OBV, we aim to offer valuable insights and predictions for the upcoming days.
Trend Analysis:
- Moving Averages (MA): The 5-day moving average has been consistently above the closing prices, indicating a short-term uptrend.
- MACD: The MACD line has been positive and above the signal line, suggesting bullish momentum.
- EMA: The exponential moving average has been trending upwards, supporting the bullish sentiment.
Key Observation: The trend indicators point towards an upward trajectory for LQIG.
Momentum Analysis:
- RSI: The Relative Strength Index has been fluctuating around the neutral zone, indicating a balanced momentum.
- Stochastic Oscillator: Both %K and %D have been in the overbought territory, suggesting potential for a pullback.
- Williams %R: The Williams %R is in the oversold region, signaling a possible reversal.
Key Observation: Momentum indicators suggest a mixed sentiment with a slight bearish bias.
Volatility Analysis:
- Bollinger Bands: The stock price has been trading within the bands, indicating normal volatility.
- Bollinger %B: The %B indicator has been hovering around the midline, reflecting equilibrium.
- Bollinger Bandwidth: The bandwidth has been relatively stable, suggesting consistent volatility levels.
Key Observation: Volatility indicators imply a sideways movement with no clear directional bias.
Volume Analysis:
- On-Balance Volume (OBV): The OBV has been fluctuating but without a clear trend, signaling indecision among investors.
- Chaikin Money Flow (CMF): The CMF has been negative, indicating selling pressure in the market.
Key Observation: Volume indicators point towards a neutral stance with a slight bearish inclination.
Conclusion:
Based on the analysis of trend, momentum, volatility, and volume indicators, the next few days for LQIG are likely to see mixed price movements. While the trend indicators suggest an upward bias, momentum and volume indicators indicate a bearish sentiment. The volatility remains stable, implying a sideways trend in the near term.
Recommendation:
Considering the overall analysis, it is advisable to exercise caution and closely monitor the price action of LQIG in the coming days. Traders may consider implementing risk management strategies to navigate the potential mixed market conditions effectively.