Technical Analysis of LRGE 2024-05-10
Overview:
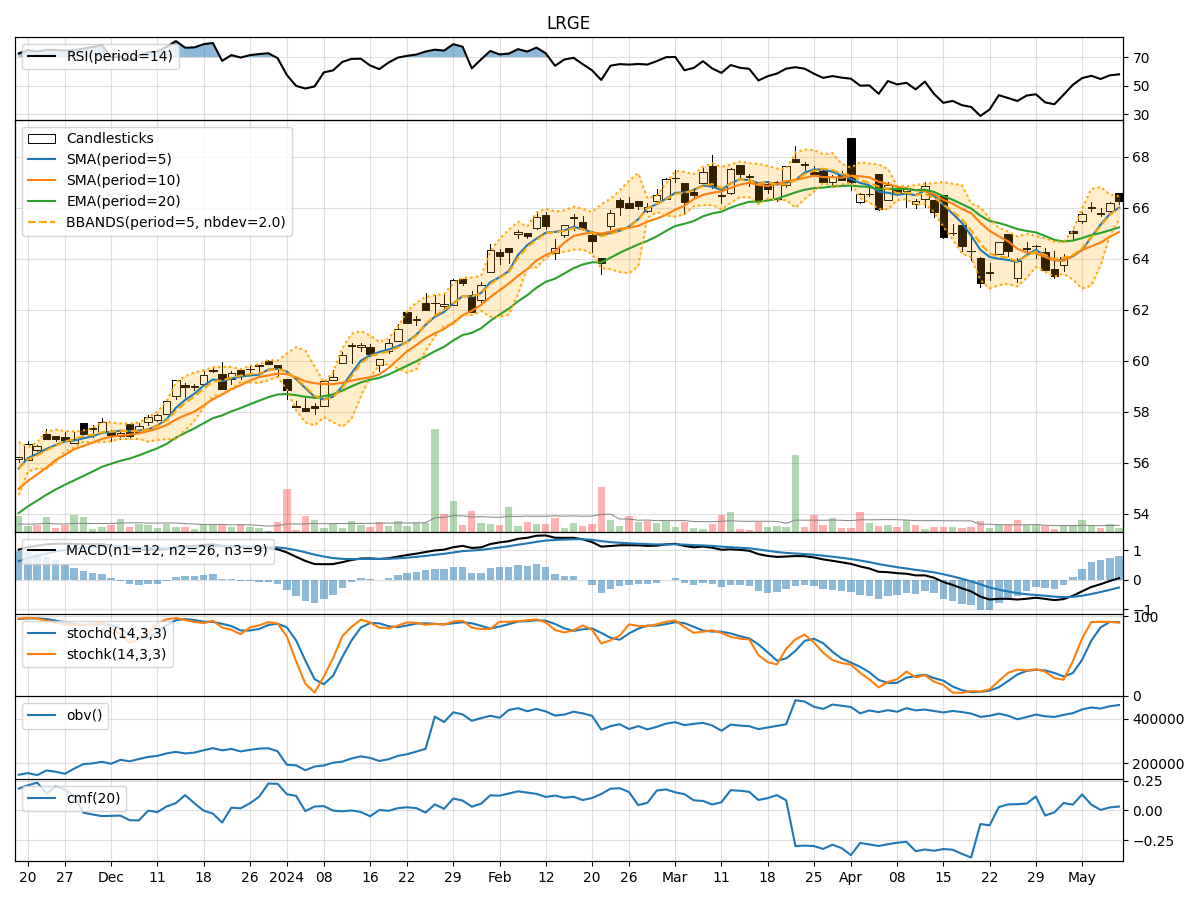
In analyzing the technical indicators for LRGE stock over the last 5 days, we will delve into the trend, momentum, volatility, and volume indicators to provide a comprehensive outlook on the possible stock price movement in the coming days. By examining these key indicators, we aim to offer valuable insights and predictions for potential investors.
Trend Indicators:
- Moving Averages (MA): The 5-day moving average has been consistently rising, indicating a bullish trend in the short term.
- MACD: The MACD line has been positive and increasing, suggesting upward momentum.
- EMA: The exponential moving average has been trending upwards, supporting the bullish sentiment.
Momentum Indicators:
- RSI: The Relative Strength Index has been in the neutral to slightly overbought territory, indicating potential strength in the stock.
- Stochastic Oscillator: Both %K and %D have been in the overbought zone, signaling potential for a pullback.
- Williams %R: The Williams %R is in the oversold region, suggesting a possible reversal to the upside.
Volatility Indicators:
- Bollinger Bands: The stock price has been trading within the bands, indicating normal volatility.
- Bollinger %B: The %B indicator shows the stock is currently trading close to the upper band, suggesting a potential overbought condition.
Volume Indicators:
- On-Balance Volume (OBV): The OBV has been increasing, indicating accumulation by investors.
- Chaikin Money Flow (CMF): The CMF has been positive, suggesting buying pressure in the stock.
Key Observations and Opinions:
- Trend: The trend indicators point towards a bullish sentiment in the short term.
- Momentum: Momentum indicators suggest a potential for a pullback due to overbought conditions.
- Volatility: Volatility has been normal, but the %B indicator hints at a possible overbought scenario.
- Volume: Accumulation is evident from the OBV and CMF, supporting the bullish outlook.
Conclusion:
Based on the analysis of the technical indicators, the stock price of LRGE is likely to experience a short-term pullback due to overbought conditions indicated by momentum indicators. However, the overall trend remains bullish, supported by moving averages and volume accumulation. Traders should be cautious of the potential pullback but can consider buying opportunities on dips for a continuation of the upward trend.