Technical Analysis of LRGF 2024-05-10
Overview:
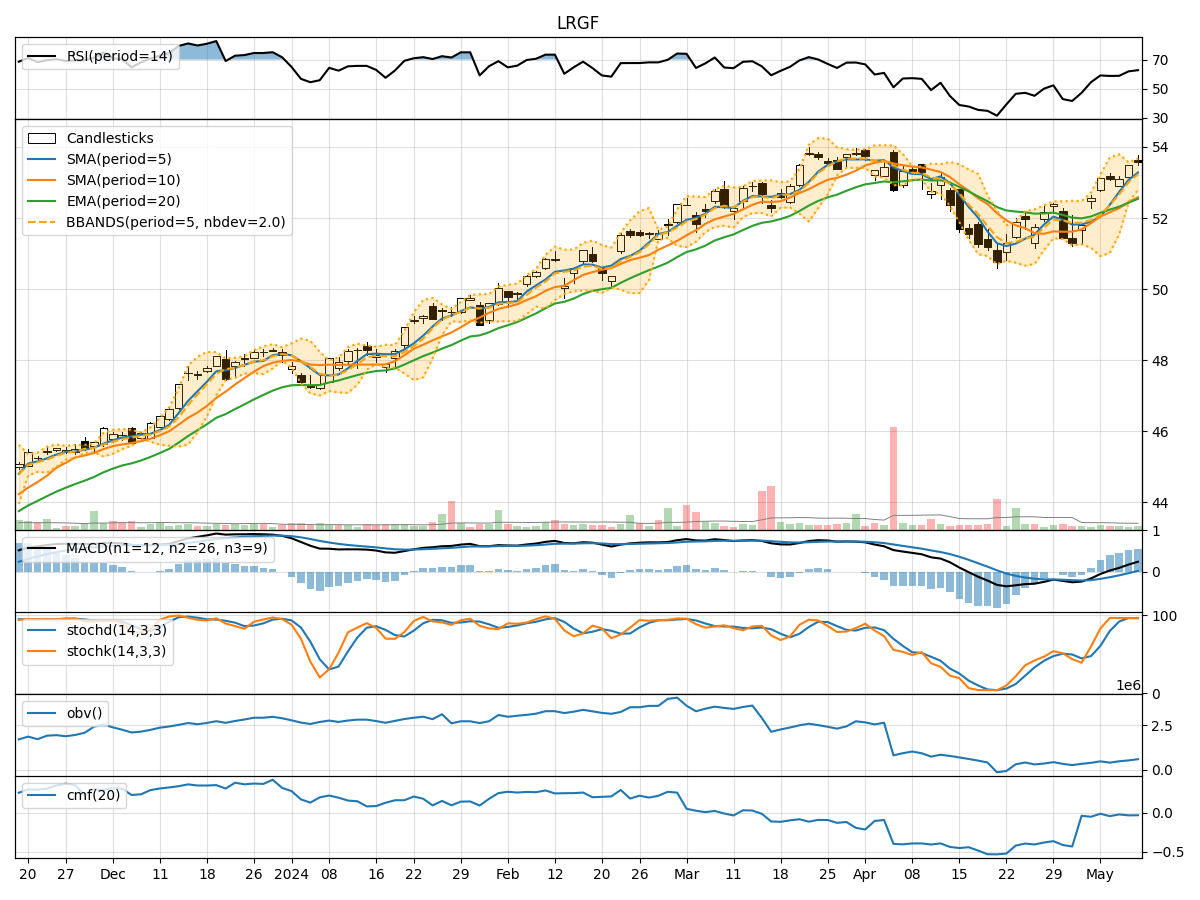
In analyzing the technical indicators for LRGF over the last 5 days, we will delve into the trend, momentum, volatility, and volume indicators to provide a comprehensive outlook on the possible stock price movement in the coming days.
Trend Analysis:
- Moving Averages (MA): The 5-day MA has been consistently above the closing prices, indicating a bullish trend.
- MACD: The MACD line has been consistently above the signal line, suggesting a bullish momentum.
- RSI: The RSI has been in the overbought territory, indicating a strong bullish momentum.
Momentum Analysis:
- Stochastic Oscillator: Both %K and %D have been in the overbought zone, signaling a strong bullish momentum.
- Williams %R: The indicator has been consistently in the oversold territory, indicating a strong bullish sentiment.
Volatility Analysis:
- Bollinger Bands (BB): The stock price has been trading within the bands, showing moderate volatility.
- BB Percentage (BBP): The BBP has been fluctuating around 0.8, indicating moderate volatility.
Volume Analysis:
- On-Balance Volume (OBV): The OBV has been showing a slight decrease, suggesting some distribution.
- Chaikin Money Flow (CMF): The CMF has been negative, indicating selling pressure.
Conclusion:
Based on the analysis of the technical indicators, the stock of LRGF is currently in a strong bullish trend with positive momentum and moderate volatility. However, there are signs of distribution in volume indicators.
Possible Stock Price Movement:
Given the current bullish trend and momentum, it is likely that the stock price of LRGF will continue to move upwards in the next few days. Traders and investors can consider buying opportunities to capitalize on the positive momentum. However, it is essential to monitor the volume indicators closely for any signs of a potential reversal in the trend.
Key Recommendations:
- Consider buying opportunities in LRGF based on the strong bullish trend and momentum.
- Monitor volume indicators for any signs of distribution or potential trend reversal.
- Set appropriate stop-loss levels to manage risk in case of unexpected price movements.
By combining technical analysis with market insights, traders can make informed decisions to navigate the dynamic stock market environment effectively.