Technical Analysis of LRNZ 2024-05-10
Overview:
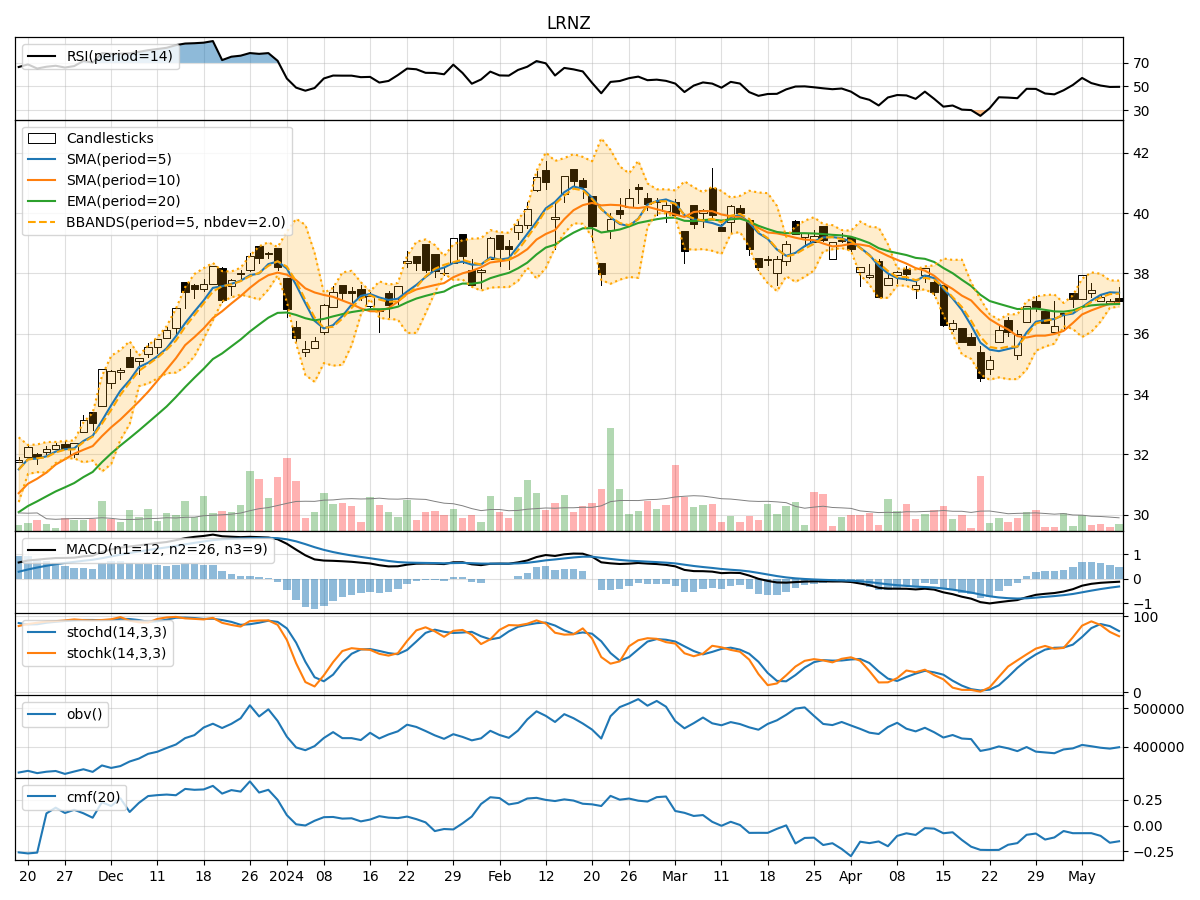
In the last 5 trading days, LRNZ stock has shown mixed signals across various technical indicators. The trend indicators suggest a slightly bearish sentiment, with the Moving Average Convergence Divergence (MACD) showing negative values. Momentum indicators like the Relative Strength Index (RSI) and Stochastic Oscillator indicate a neutral to slightly bearish momentum. Volatility indicators show a narrowing Bollinger Bands (BB) width, indicating potential consolidation. Volume indicators suggest a slight distribution of shares.
Trend Indicators:
- Moving Averages (MA) show a slightly upward trend, but the MACD is negative, indicating a bearish sentiment.
- The Exponential Moving Average (EMA) is relatively flat, suggesting a lack of strong trend direction.
- The MACD Histogram (MACDH) is positive, but decreasing, signaling a potential reversal.
Momentum Indicators:
- The RSI is in the neutral zone, indicating indecision among investors.
- Stochastic Oscillator shows a bearish crossover, suggesting a potential downward movement.
- Williams %R (WillR) is in oversold territory, indicating a possible reversal.
Volatility Indicators:
- Bollinger Bands are narrowing, indicating decreasing volatility and a potential period of consolidation.
- The Bollinger Bands Percentage (BBP) is low, suggesting a lack of significant price movement.
Volume Indicators:
- On-Balance Volume (OBV) is negative, indicating a slight distribution of shares.
- Chaikin Money Flow (CMF) is negative, suggesting selling pressure.
Conclusion:
Based on the analysis of the technical indicators, the next few days for LRNZ stock are likely to see sideways movement with a slight bearish bias. The trend indicators show a lack of strong trend direction, while momentum indicators suggest a neutral to slightly bearish sentiment. Volatility indicators point towards a period of consolidation, and volume indicators indicate a slight distribution of shares.
Recommendation:
- Caution is advised for short-term traders as the stock may experience limited price movement.
- Long-term investors may consider waiting for clearer signals before making significant decisions.
- Monitoring key levels such as support and resistance can provide valuable insights for potential entry or exit points.
Key Words:
- Sideways movement
- Slight bearish bias
- Caution advised
- Wait for clearer signals