Technical Analysis of LSAF 2024-05-10
Overview:
In analyzing the provided Technical Analysis (TA) data for the last 5 days, we will delve into the trend, momentum, volatility, and volume indicators to forecast the possible stock price movement for the next few days. By examining these key indicators, we aim to provide a comprehensive and insightful prediction backed by data-driven analysis.
Trend Indicators:
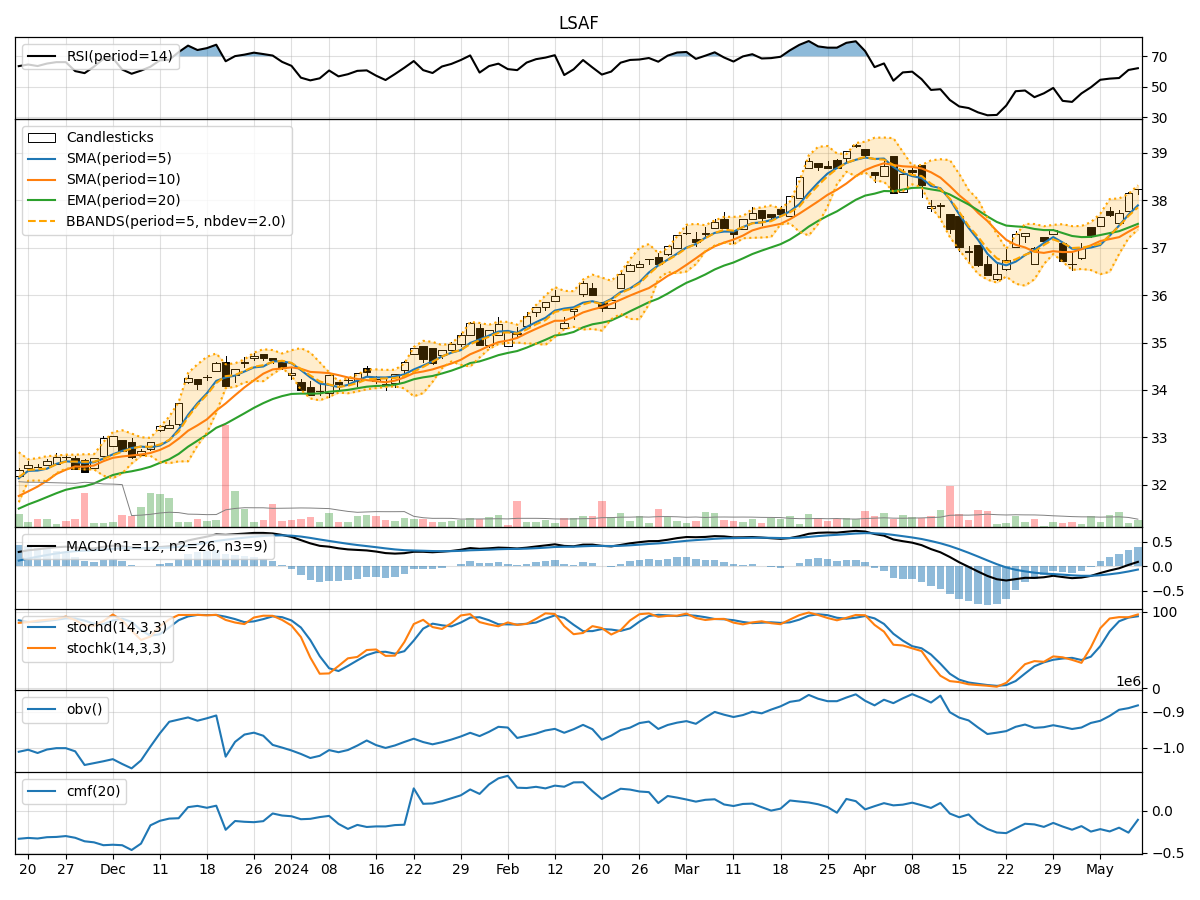
- Moving Averages (MA): The 5-day MA has been consistently above the closing prices, indicating a bullish trend.
- MACD: The MACD line has been positive for the past 5 days, suggesting upward momentum.
- RSI: The RSI values have been increasing, reflecting strengthening bullish momentum.
Key Observation: The trend indicators suggest a bullish sentiment in the stock price movement.
Momentum Indicators:
- Stochastic Oscillator: Both %K and %D values have been in the overbought zone, indicating a strong bullish momentum.
- Williams %R: The Williams %R values have been consistently negative, signaling a potential reversal to the upside.
Key Observation: Momentum indicators point towards a continuation of the bullish momentum.
Volatility Indicators:
- Bollinger Bands (BB): The stock price has been trading within the bands, with the upper band acting as a resistance level.
- BB Percentage (BBP): The BBP values have been fluctuating around 0.8, indicating moderate volatility.
Key Observation: Volatility indicators suggest a stable price movement within a defined range.
Volume Indicators:
- On-Balance Volume (OBV): The OBV values have been increasing, indicating accumulation by investors.
- Chaikin Money Flow (CMF): The CMF values have been negative, suggesting some selling pressure.
Key Observation: Volume indicators show a mixed sentiment with accumulation in OBV but selling pressure in CMF.
Conclusion:
Based on the analysis of trend, momentum, volatility, and volume indicators, the overall outlook for the next few days is bullish. The stock is likely to experience an upward price movement supported by the strong bullish trend and momentum indicators. However, the presence of resistance at the upper Bollinger Band may lead to some consolidation before a potential breakout.
Investors should consider buying opportunities on pullbacks within the bullish trend, while also monitoring the resistance levels indicated by the Bollinger Bands. It is essential to set appropriate stop-loss levels to manage risk effectively.
In conclusion, the stock is poised for further upside based on the technical analysis, but prudent risk management strategies should be in place to navigate potential market fluctuations.