Technical Analysis of LSEQ 2024-05-10
Overview:
In analyzing the technical indicators for LSEQ stock over the last 5 days, we will delve into the trend, momentum, volatility, and volume indicators to provide a comprehensive outlook on the possible stock price movement in the coming days. By examining key metrics such as moving averages, MACD, RSI, Bollinger Bands, and OBV, we aim to offer valuable insights and predictions for potential price trends.
Trend Indicators:
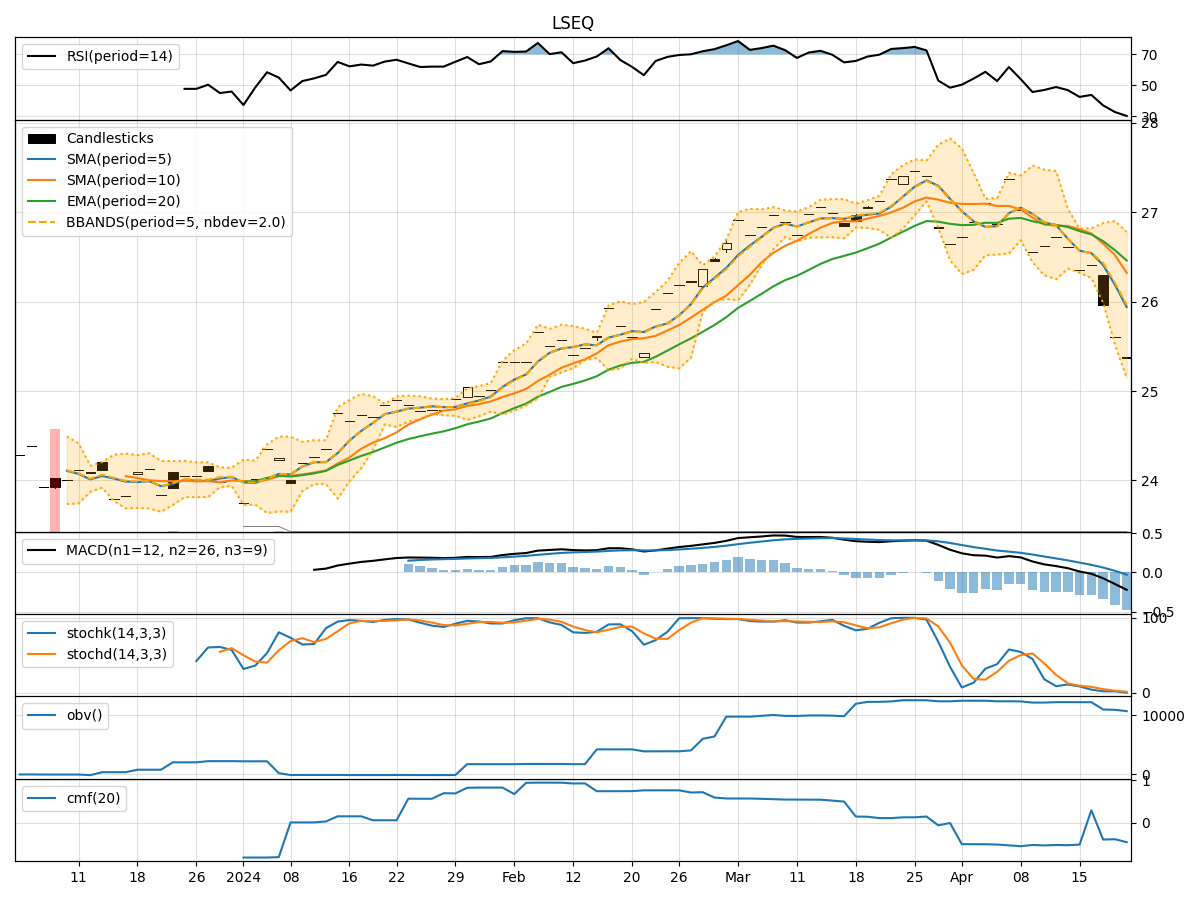
- Moving Averages (MA): The 5-day moving average has been consistently above the closing prices, indicating a short-term uptrend.
- MACD: The MACD line has been negative but trending upwards, suggesting a potential reversal in the bearish momentum.
- MACD Histogram: The histogram has been increasing, indicating a strengthening bullish momentum.
Momentum Indicators:
- RSI: The RSI has been fluctuating around the 50 level, indicating a lack of strong momentum in either direction.
- Stochastic Oscillator: Both %K and %D have been in overbought territory, suggesting a potential reversal or consolidation phase.
- Williams %R: The indicator has been hovering around the oversold region, signaling a possible buying opportunity.
Volatility Indicators:
- Bollinger Bands: The price has been trading within the bands, indicating a period of consolidation.
- Bollinger %B: The %B indicator has been fluctuating around the midline, suggesting a lack of clear trend direction.
Volume Indicators:
- On-Balance Volume (OBV): The OBV has been relatively flat, indicating a balance between buying and selling pressure.
- Chaikin Money Flow (CMF): The CMF has been negative, reflecting a net outflow of money from the stock.
Key Observations:
- The trend indicators suggest a potential reversal in the short-term bearish trend.
- Momentum indicators show mixed signals, with RSI indicating neutrality and stochastic oscillators hinting at a possible reversal.
- Volatility indicators point towards a period of consolidation with no clear trend direction.
- Volume indicators reflect a balanced market sentiment with no significant accumulation or distribution.
Conclusion:
Based on the analysis of the technical indicators, the next few days for LSEQ stock are likely to see sideways movement or consolidation. The lack of strong trend signals from the indicators indicates a period of indecision among market participants. Traders may consider staying on the sidelines until clearer signals emerge. It is advisable to closely monitor key levels and wait for a decisive breakout or breakdown before taking any significant trading positions.