Technical Analysis of LSGR 2024-05-10
Overview:
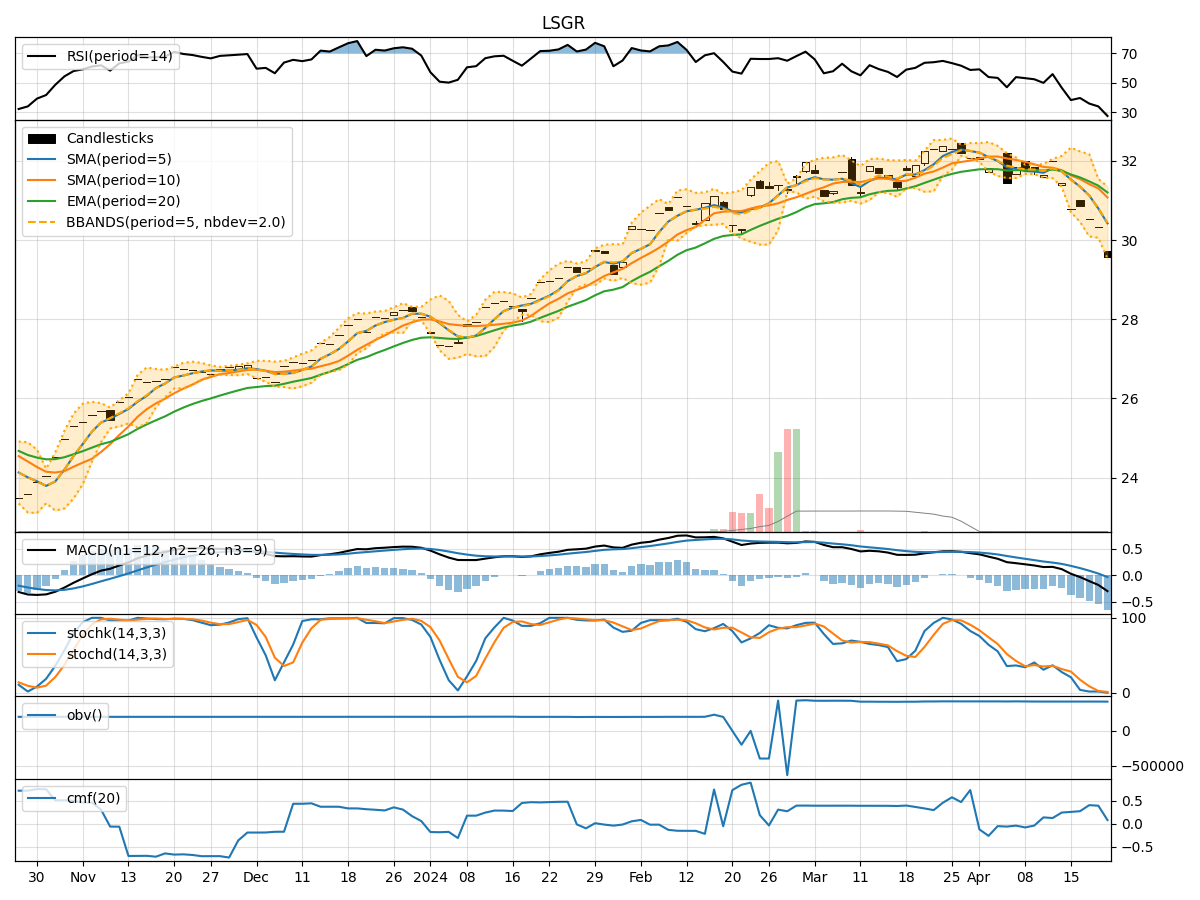
In analyzing the technical indicators for LSGR over the last 5 days, we will delve into the trend, momentum, volatility, and volume indicators to provide a comprehensive outlook on the possible stock price movement in the coming days.
Trend Indicators:
- Moving Averages (MA): The 5-day MA has been consistently above the 10-day SMA, indicating a short-term bullish trend.
- MACD: The MACD line has been negative but converging towards the signal line, suggesting a potential reversal in the bearish momentum.
- EMA: The EMA has been steadily increasing, reflecting a positive trend in the stock price.
Momentum Indicators:
- RSI: The RSI has been hovering around the neutral zone, indicating a balanced momentum in the stock.
- Stochastic Oscillator: Both %K and %D have been in the overbought territory, signaling a potential reversal or consolidation.
- Williams %R: The indicator has been fluctuating near the oversold region, suggesting a possible buying opportunity.
Volatility Indicators:
- Bollinger Bands (BB): The bands have been narrowing, indicating decreasing volatility and a potential breakout or breakdown.
- BB %B: The %B indicator has been fluctuating within a tight range, suggesting a period of consolidation.
- BB Width: The narrowing of the bands suggests a potential price breakout or breakdown in the near future.
Volume Indicators:
- On-Balance Volume (OBV): The OBV has been relatively stable, indicating a balance between buying and selling pressure.
- Chaikin Money Flow (CMF): The CMF has been positive, reflecting accumulation in the stock.
Key Observations and Opinions:
- Trend: The stock is currently in a short-term bullish trend based on moving averages and EMA.
- Momentum: The momentum indicators suggest a mixed sentiment with potential for a reversal or consolidation.
- Volatility: The decreasing volatility implies a period of consolidation before a potential breakout.
- Volume: The volume indicators show a balanced buying and selling pressure in the stock.
Conclusion:
Based on the analysis of the technical indicators, the stock of LSGR is likely to experience sideways movement in the coming days. Traders may observe a period of consolidation before a potential breakout or breakdown. It is advisable to closely monitor key levels such as support and resistance for potential trading opportunities.