Technical Analysis of LTL 2024-05-10
Overview:
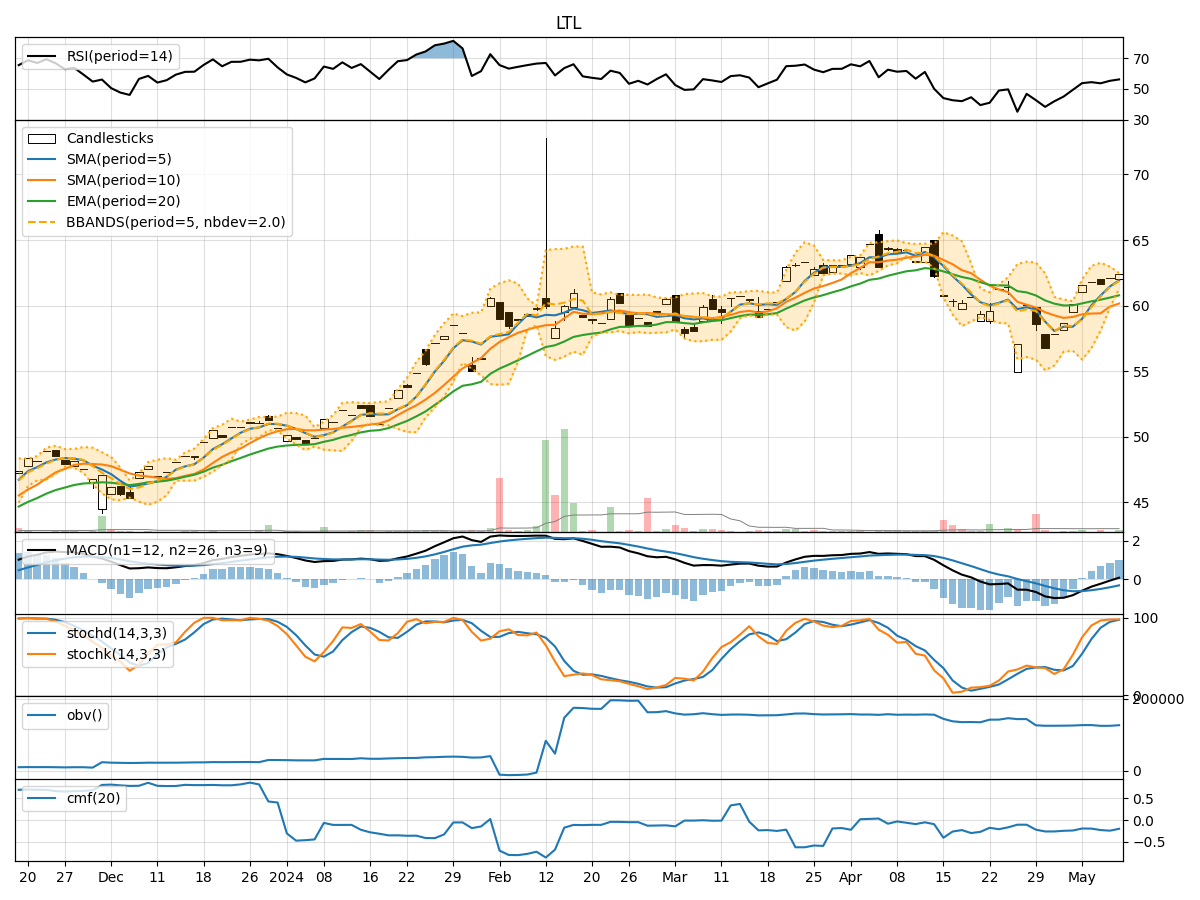
In the last 5 trading days, the stock price of LTL has shown a gradual increase, with some fluctuations in between. Various technical indicators have been analyzed to provide insights into the possible future stock price movement. The analysis includes trend indicators, momentum indicators, volatility indicators, and volume indicators.
Trend Indicators:
- Moving Averages (MA): The 5-day Moving Average has been consistently above the Simple Moving Average (SMA) and Exponential Moving Average (EMA), indicating a bullish trend.
- MACD: The MACD line has been consistently above the signal line, suggesting a bullish momentum.
- RSI: The Relative Strength Index (RSI) has been fluctuating around the overbought territory, indicating a strong bullish momentum.
Momentum Indicators:
- Stochastic Oscillator: Both %K and %D have been consistently high, indicating a strong bullish momentum.
- Williams %R: The indicator has been hovering around oversold levels, suggesting a potential reversal in the short term.
Volatility Indicators:
- Bollinger Bands: The stock price has been trading within the bands, with the upper band acting as a resistance level.
- Bollinger %B: The %B indicator has been fluctuating within the range, indicating moderate volatility.
Volume Indicators:
- On-Balance Volume (OBV): The OBV has shown a slight decrease, suggesting some distribution of shares.
- Chaikin Money Flow (CMF): The CMF has been negative, indicating selling pressure in the stock.
Key Observations and Opinions:
- Trend: The trend indicators suggest a strong bullish sentiment in the stock.
- Momentum: Momentum indicators also support the bullish view, with strong buying pressure.
- Volatility: Volatility indicators show moderate fluctuations in the stock price.
- Volume: The volume indicators indicate some distribution of shares and selling pressure.
Conclusion:
Based on the analysis of the technical indicators, the next few days' possible stock price movement for LTL is likely to continue in an upward direction. The bullish trend, supported by momentum indicators and moderate volatility, suggests that the stock price may experience further gains. However, investors should closely monitor the volume indicators for any signs of a potential reversal in the trend. Overall, the outlook for LTL appears bullish in the short term.