Technical Analysis of LVHI 2024-05-10
Overview:
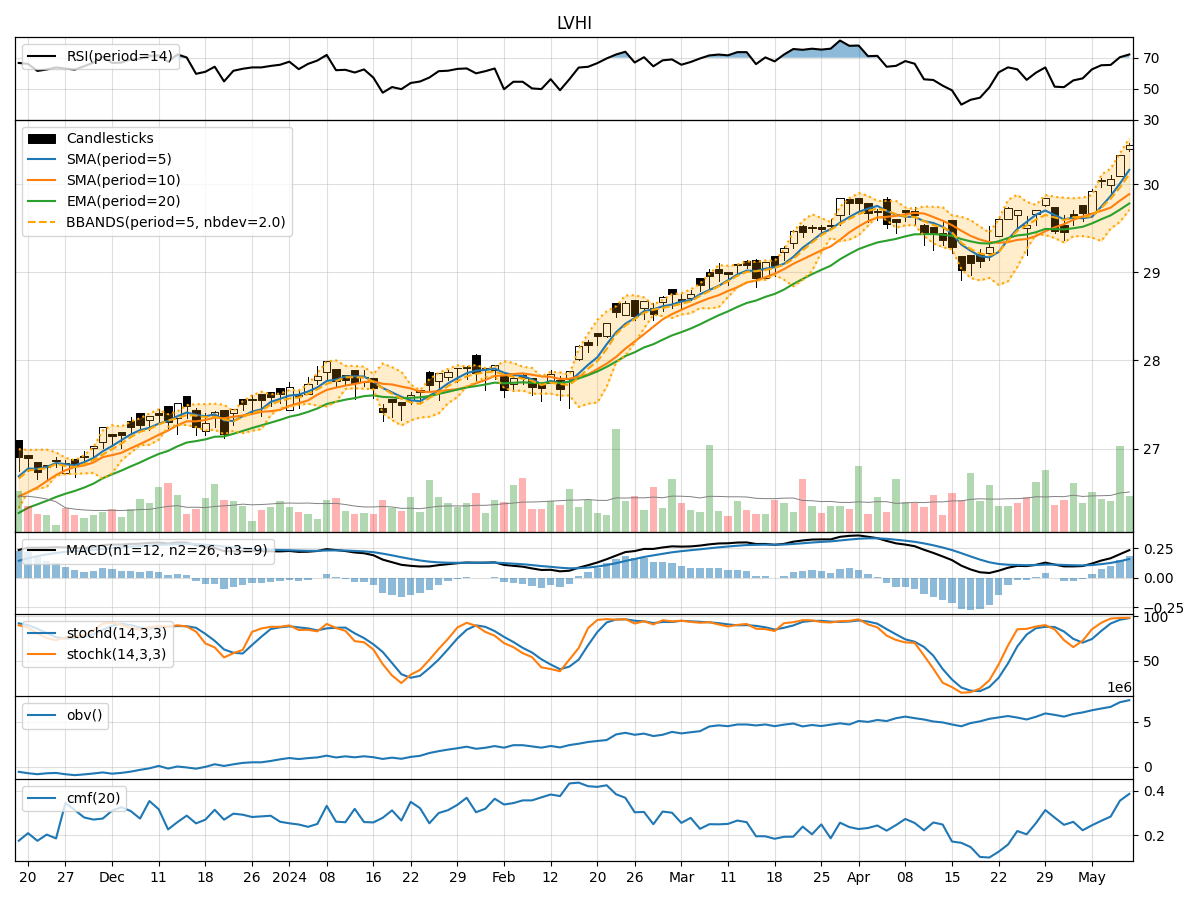
In analyzing the technical indicators for LVHI over the last 5 days, we will delve into the trend, momentum, volatility, and volume indicators to provide a comprehensive outlook on the possible stock price movement in the coming days.
Trend Indicators:
- Moving Averages (MA): The 5-day MA has been consistently above the closing prices, indicating a bullish trend.
- MACD: The MACD line has been above the signal line, suggesting a bullish momentum.
- EMA: The EMA has been trending upwards, supporting the bullish sentiment.
Key Observation: The trend indicators point towards a bullish outlook for LVHI.
Momentum Indicators:
- RSI: The RSI has been in the overbought territory, indicating strong buying momentum.
- Stochastic Oscillator: Both %K and %D have been in the overbought zone, signaling a strong bullish momentum.
- Williams %R: The indicator has been in the oversold region, suggesting a potential reversal.
Key Observation: Momentum indicators reflect a strong bullish sentiment for LVHI.
Volatility Indicators:
- Bollinger Bands: The stock price has been trading within the bands, indicating moderate volatility.
- Bollinger %B: The %B has been fluctuating within a reasonable range, suggesting stable price movements.
Key Observation: Volatility indicators imply moderate stability in LVHI's price movements.
Volume Indicators:
- On-Balance Volume (OBV): The OBV has been steadily increasing, indicating strong buying pressure.
- Chaikin Money Flow (CMF): The CMF has been positive, reflecting a bullish money flow into the stock.
Key Observation: Volume indicators signal strong buying interest in LVHI.
Conclusion:
Based on the analysis of trend, momentum, volatility, and volume indicators, the overall outlook for LVHI is strongly bullish. The stock is likely to experience further upward movement in the coming days. Traders and investors may consider buying positions in LVHI to capitalize on the positive momentum and volume influx. It is essential to monitor the indicators closely for any signs of reversal or consolidation, but the current trend suggests a continuation of the bullish momentum.