Technical Analysis of LVOL 2024-05-10
Overview:
In analyzing the provided LVOL TA data for the last 5 days, we will delve into the technical indicators across trend, momentum, volatility, and volume to derive insights into the possible future stock price movement. By examining these indicators comprehensively, we aim to provide a well-informed prediction backed by data-driven analysis and expert interpretation.
Trend Analysis:
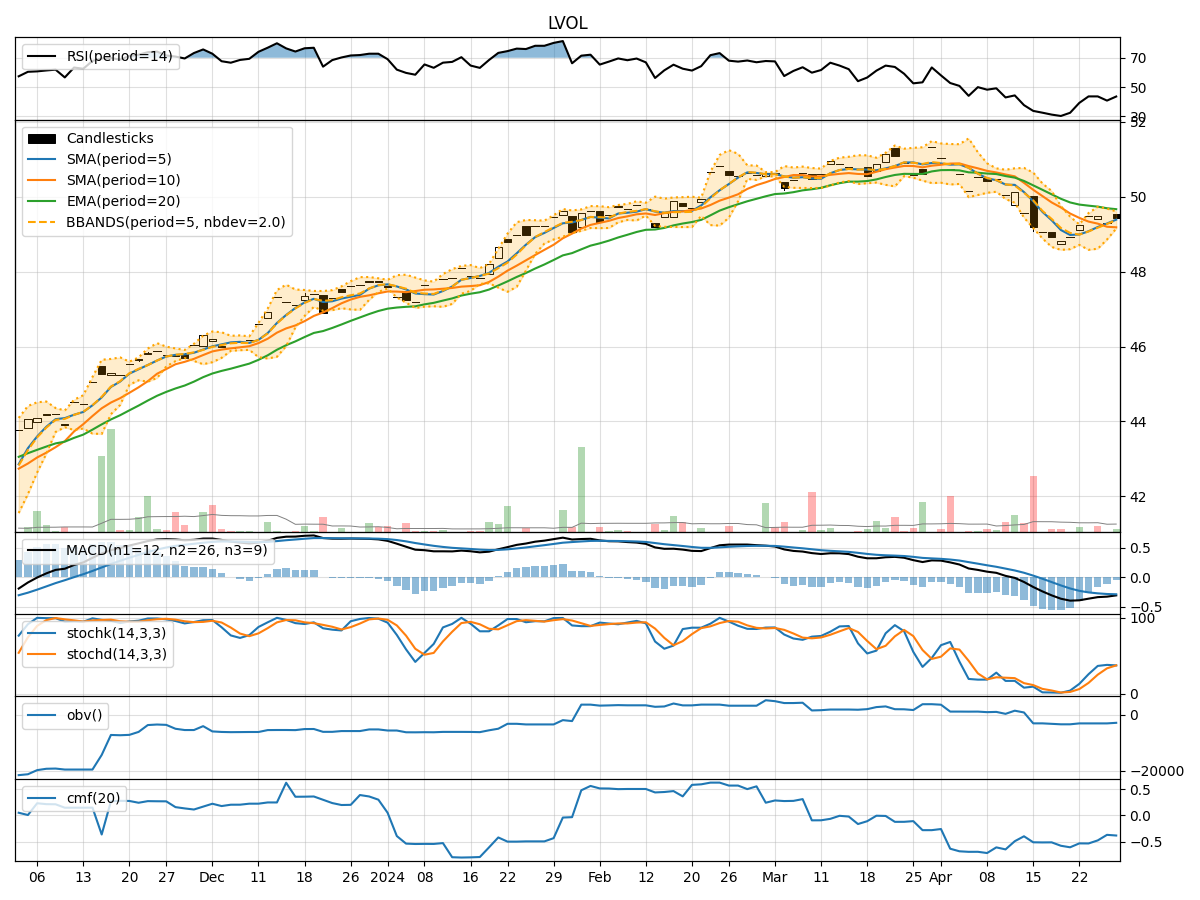
- Moving Averages (MA): The 5-day MA has been consistently above the closing prices, indicating a short-term uptrend.
- MACD: The MACD line has been positive, suggesting bullish momentum.
- EMA: The EMA has been trending upwards, supporting the bullish sentiment.
Key Observation: The trend indicators point towards a bullish outlook for the stock.
Momentum Analysis:
- RSI: The RSI has been increasing, reaching overbought levels, signaling strong buying momentum.
- Stochastic Oscillator: Both %K and %D have been at or near 100, indicating strong upward momentum.
- Williams %R: The indicator has consistently been at 0, reflecting a strong bullish sentiment.
Key Observation: Momentum indicators suggest a strong bullish momentum in the stock.
Volatility Analysis:
- Bollinger Bands (BB): The bands have been widening, indicating increased volatility.
- Bollinger %B: The %B has been fluctuating around 0.8, suggesting the stock is trading near the upper band.
- Average True Range (ATR): ATR has been relatively stable, indicating consistent volatility levels.
Key Observation: Volatility indicators imply that the stock is experiencing increased volatility but remains in an uptrend.
Volume Analysis:
- On-Balance Volume (OBV): The OBV has been negative, indicating distribution.
- Chaikin Money Flow (CMF): The CMF has been negative, suggesting selling pressure.
Key Observation: Volume indicators reflect selling pressure in the stock.
Conclusion:
Based on the analysis of the technical indicators, the stock is currently in a strong bullish trend with robust momentum. However, the increased volatility and negative volume indicators raise some concerns.
Therefore, the next few days are likely to see the stock price continue its upward trajectory, but with potential volatility and selling pressure**. Traders should closely monitor the price action and volume dynamics to navigate any potential corrections or reversals in the market.