Technical Analysis of MAGG 2024-05-10
Overview:
In analyzing the technical indicators for MAGG stock over the last 5 days, we will delve into the trends, momentum, volatility, and volume indicators to provide a comprehensive outlook on the possible stock price movement in the coming days. By examining key metrics such as moving averages, MACD, RSI, Bollinger Bands, and OBV, we aim to offer valuable insights and recommendations for potential trading strategies.
Trend Indicators:
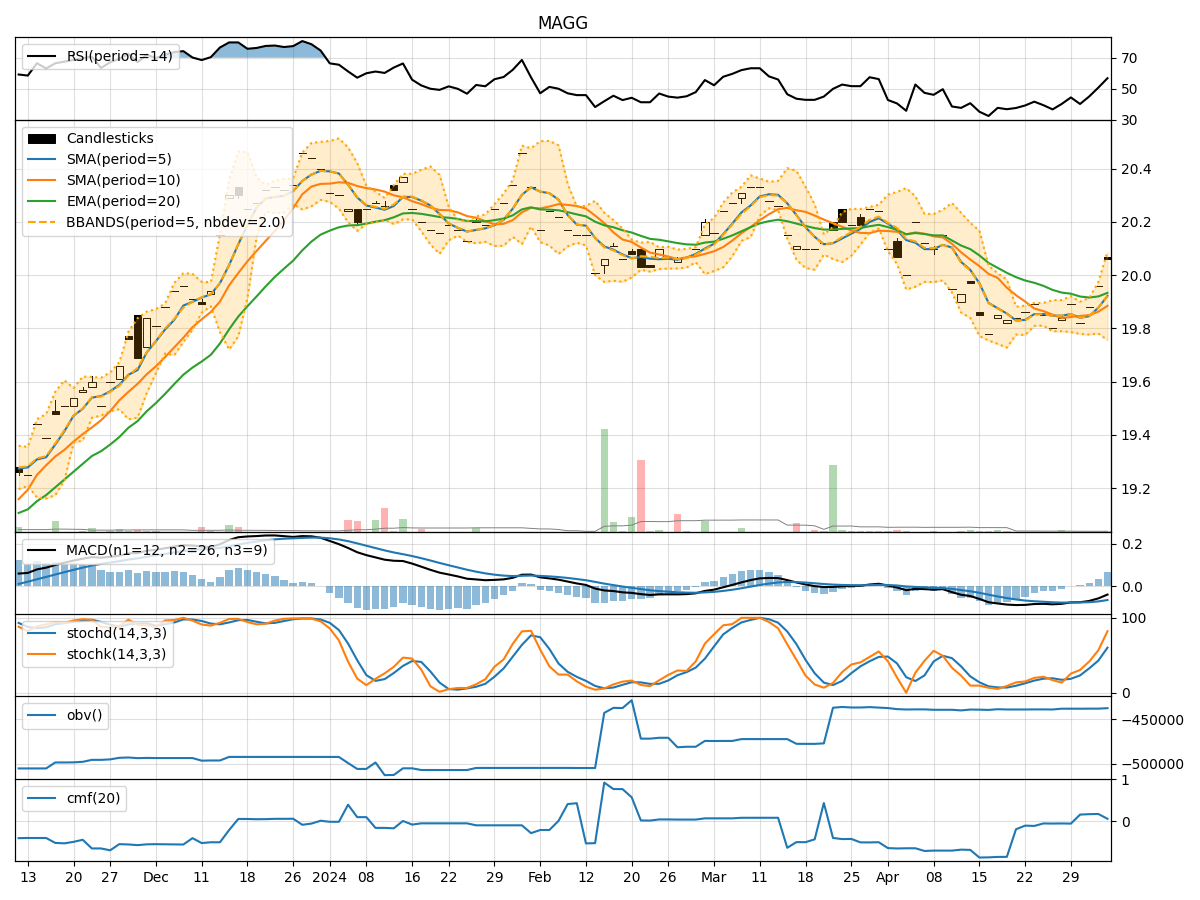
- Moving Averages (MA): The 5-day MA has been consistently above the closing prices, indicating a short-term uptrend.
- MACD: The MACD line has been above the signal line, suggesting bullish momentum.
- RSI: The RSI values have been fluctuating around the neutral zone, indicating indecision in the market sentiment.
Momentum Indicators:
- Stochastic Oscillator: The Stochastic Oscillator has been in the overbought region, signaling a potential reversal or consolidation.
- Williams %R (WillR): The WillR values have been negative, indicating an oversold condition.
Volatility Indicators:
- Bollinger Bands (BB): The stock price has been trading within the Bollinger Bands, suggesting a period of consolidation.
- BB% (BB Percentage): The BB% values have been relatively low, indicating a lack of significant price movement.
Volume Indicators:
- On-Balance Volume (OBV): The OBV values have remained constant, reflecting a balance between buying and selling pressure.
- Chaikin Money Flow (CMF): The CMF values have been positive, indicating potential accumulation by investors.
Key Observations:
- The stock is currently in a consolidation phase, as indicated by the trading within the Bollinger Bands and the neutral RSI values.
- The Stochastic Oscillator being in the overbought region suggests a possible reversal or a period of sideways movement.
- The MACD line being above the signal line indicates bullish momentum in the short term.
Conclusion:
Based on the analysis of the technical indicators, the next few days for MAGG stock are likely to see sideways movement or consolidation. The stock may trade within a narrow range as it digests the recent price action. Traders should exercise caution and wait for clearer signals before initiating new positions. It is advisable to monitor key levels such as support and resistance for potential breakout or breakdown scenarios.