Technical Analysis of MAGQ 2024-05-10
Overview:
In analyzing the technical indicators for MAGQ over the last 5 days, we will delve into the trend, momentum, volatility, and volume indicators to provide a comprehensive outlook on the possible stock price movement in the coming days. By examining these key aspects, we aim to offer valuable insights and predictions for potential investors.
Trend Analysis:
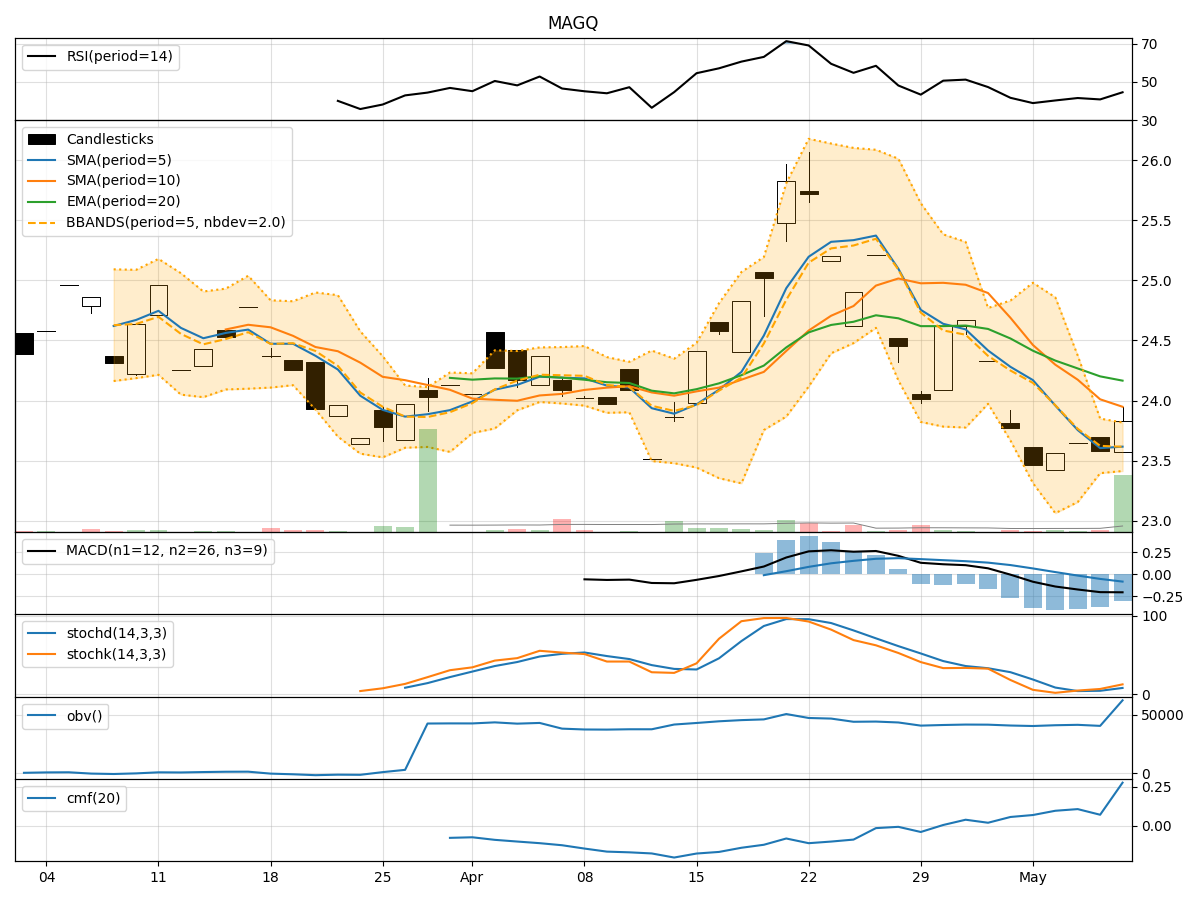
- Moving Averages (MA): The 5-day Moving Average (MA) has been consistently below the closing prices, indicating a short-term downtrend.
- MACD: The Moving Average Convergence Divergence (MACD) has been negative, suggesting a bearish momentum in the stock.
- EMA: The Exponential Moving Average (EMA) has been declining, further supporting the bearish trend.
Momentum Analysis:
- RSI: The Relative Strength Index (RSI) has been below 50, indicating a lack of strong momentum in either direction.
- Stochastic Oscillator: Both %K and %D have been relatively low, signaling a potential oversold condition.
- Williams %R: The Williams %R is in the oversold territory, suggesting a possible reversal in the near future.
Volatility Analysis:
- Bollinger Bands: The stock price has been trading within the lower Bollinger Band, indicating lower volatility and a potential consolidation phase.
- Bollinger %B: The %B indicator is below 1, suggesting the stock is trading below the lower band and may be oversold.
Volume Analysis:
- On-Balance Volume (OBV): The OBV has shown an increase in volume over the last few days, indicating potential buying interest.
- Chaikin Money Flow (CMF): The CMF has been positive, suggesting that money is flowing into the stock.
Conclusion:
Based on the analysis of the technical indicators, the stock of MAGQ is currently in a bearish phase with a lack of strong momentum. The price is likely to continue its downward trend in the near term, possibly experiencing further consolidation or sideways movement. However, the oversold conditions indicated by the Stochastic Oscillator and Williams %R may lead to a short-term bounce or reversal. Investors should exercise caution and wait for more definitive signals before considering any buying opportunities.