Technical Analysis of MAPP 2024-05-10
Overview:
In analyzing the technical indicators for the stock based on the last 5 days of data, we will delve into the trend, momentum, volatility, and volume indicators to provide a comprehensive outlook on the possible stock price movement. By examining these key aspects, we aim to offer valuable insights and predictions for the upcoming days.
Trend Analysis:
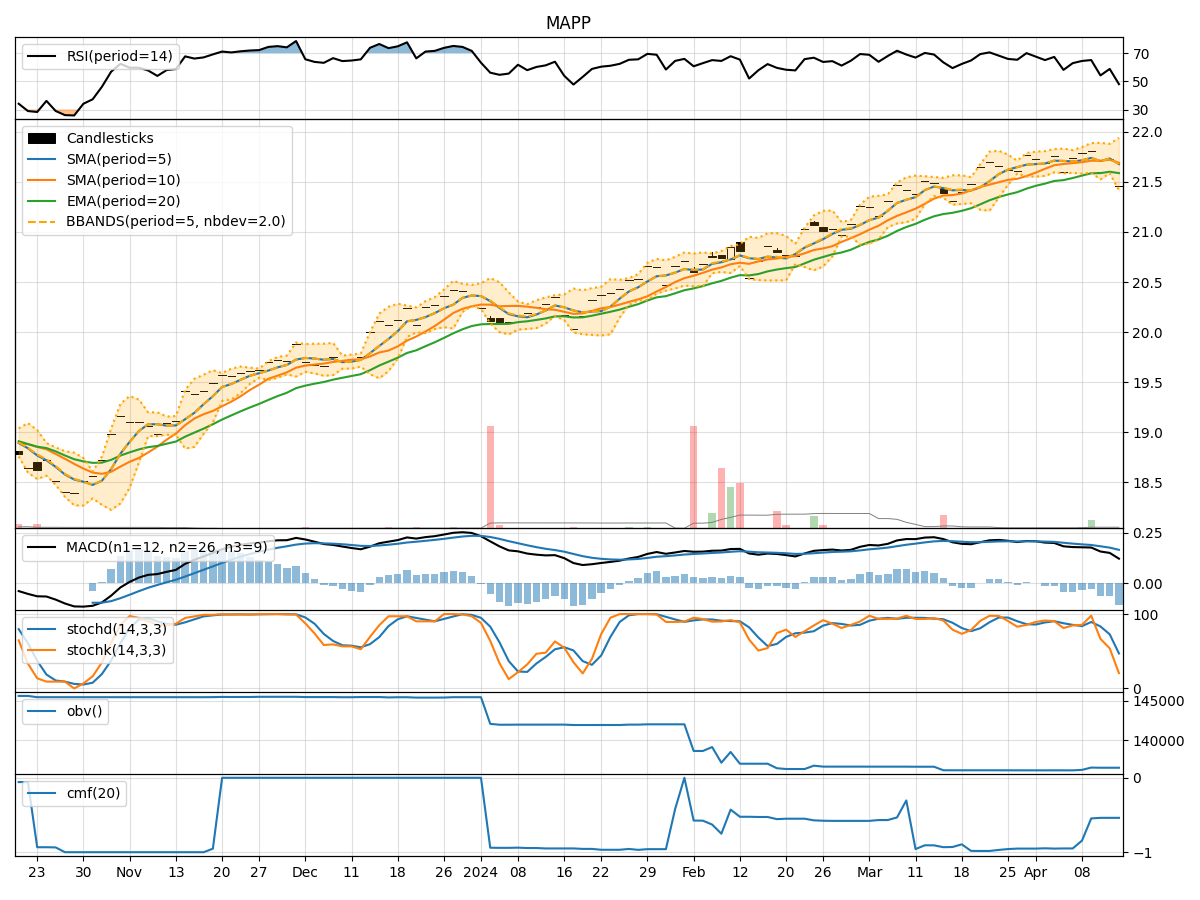
- Moving Averages (MA): The 5-day Moving Average (MA) has been consistently above the Simple Moving Average (SMA) and Exponential Moving Average (EMA), indicating a bullish trend.
- MACD: The MACD line has been consistently above the signal line, with both lines showing an upward trend, suggesting bullish momentum.
- MACD Histogram: The MACD Histogram has been increasing over the past 5 days, indicating strengthening bullish momentum.
Momentum Analysis:
- RSI: The Relative Strength Index (RSI) has been trending upwards and is currently in the overbought territory, suggesting a strong bullish momentum.
- Stochastic Oscillator: Both %K and %D lines of the Stochastic Oscillator are in the overbought zone, indicating a strong bullish momentum.
- Williams %R: The Williams %R is also in the overbought region, further supporting the bullish sentiment.
Volatility Analysis:
- Bollinger Bands: The Bollinger Bands are relatively narrow, indicating low volatility in the stock price movement.
- Bollinger %B: The %B indicator is above 0.5, suggesting that the stock price is trading closer to the upper Bollinger Band, indicating a bullish sentiment.
Volume Analysis:
- On-Balance Volume (OBV): The OBV indicator has remained constant over the past 5 days, suggesting a neutral volume trend.
- Chaikin Money Flow (CMF): The CMF is negative, indicating that money is flowing out of the stock, reflecting a bearish volume sentiment.
Conclusion:
Based on the analysis of the technical indicators: - Trend: The stock is in a strong upward trend, supported by moving averages and MACD. - Momentum: The momentum indicators suggest a strong bullish sentiment. - Volatility: The low volatility and the position of %B near the upper Bollinger Band indicate a bullish outlook. - Volume: The neutral OBV and negative CMF suggest a neutral to bearish volume sentiment.
Overall Assessment:
Considering the overall technical analysis, the stock is likely to experience further upward movement in the next few days. The bullish trend, strong momentum, low volatility, and neutral to bearish volume sentiment collectively point towards a bullish outlook for the stock price. Traders and investors may consider buying opportunities in anticipation of potential price appreciation.
Disclaimer:
This analysis is based solely on technical indicators and historical data, and it is important to conduct thorough research and consider other factors before making investment decisions. Market conditions can change rapidly, and it is advisable to consult with a financial advisor for personalized guidance tailored to individual investment goals and risk tolerance levels.