Technical Analysis of MARB 2024-05-10
Overview:
In analyzing the technical indicators for MARB over the last 5 days, we will delve into the trend, momentum, volatility, and volume indicators to provide a comprehensive outlook on the possible stock price movement in the coming days. By examining these key aspects, we aim to offer valuable insights and predictions for potential investors.
Trend Analysis:
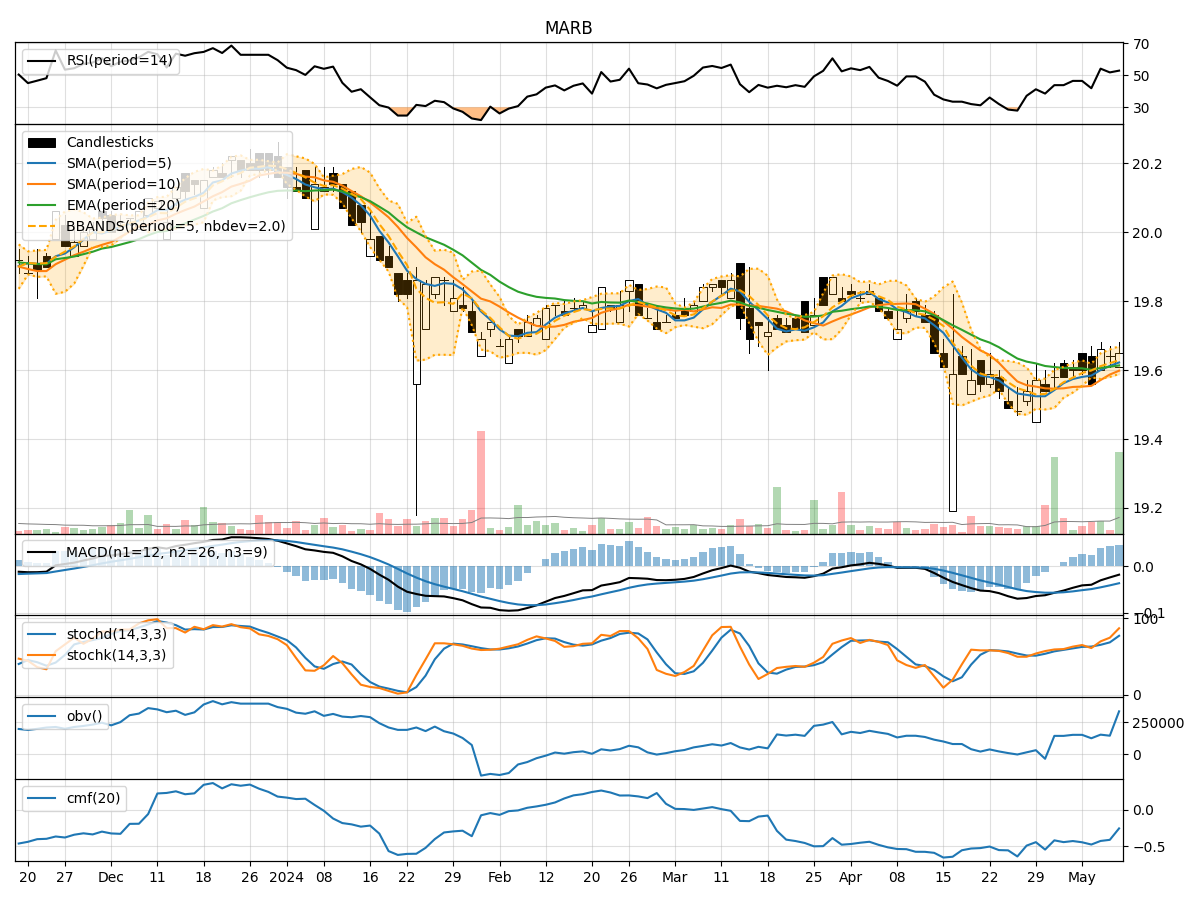
- Moving Averages (MA): The 5-day MA has been showing a slight uptrend, indicating a positive momentum in the short term.
- MACD: The MACD line has been consistently below the signal line, suggesting a bearish trend in the stock price movement.
- EMA: The EMA has been relatively stable, reflecting a neutral stance in the stock's price direction.
Momentum Analysis:
- RSI: The RSI has been fluctuating around the midline, indicating a lack of strong momentum in either direction.
- Stochastic Oscillator: The stochastic indicators have been showing overbought conditions, suggesting a potential reversal in the stock price.
- Williams %R: The Williams %R is hovering around oversold levels, signaling a possible bullish reversal.
Volatility Analysis:
- Bollinger Bands (BB): The Bollinger Bands have been widening, indicating increased volatility in the stock price.
- BB %B: The %B indicator has been fluctuating within the bands, suggesting potential price reversals.
- BB Width: The widening of the BB width indicates a higher degree of volatility in the stock.
Volume Analysis:
- On-Balance Volume (OBV): The OBV has been fluctuating, reflecting indecision among investors regarding the stock.
- Chaikin Money Flow (CMF): The CMF has been negative, indicating selling pressure in the stock.
Key Observations:
- The trend indicators suggest a neutral to slightly bullish outlook in the short term.
- Momentum indicators show mixed signals, with potential for a bullish reversal.
- Volatility indicators point towards increased price fluctuations.
- Volume indicators reflect uncertainty and selling pressure in the stock.
Conclusion:
Based on the analysis of the technical indicators, the next few days' possible stock price movement for MARB is likely to be sideways with a slight bullish bias. Investors should closely monitor the stochastic indicators for a potential bullish reversal confirmation. However, the overall market sentiment remains uncertain, so caution is advised in making investment decisions.