Technical Analysis of MARW 2024-05-10
Overview:
In analyzing the technical indicators for MARW over the last 5 days, we will delve into the trend, momentum, volatility, and volume indicators to provide a comprehensive outlook on the possible stock price movement in the coming days. By examining these key aspects, we aim to offer valuable insights and recommendations for potential investors.
Trend Analysis:
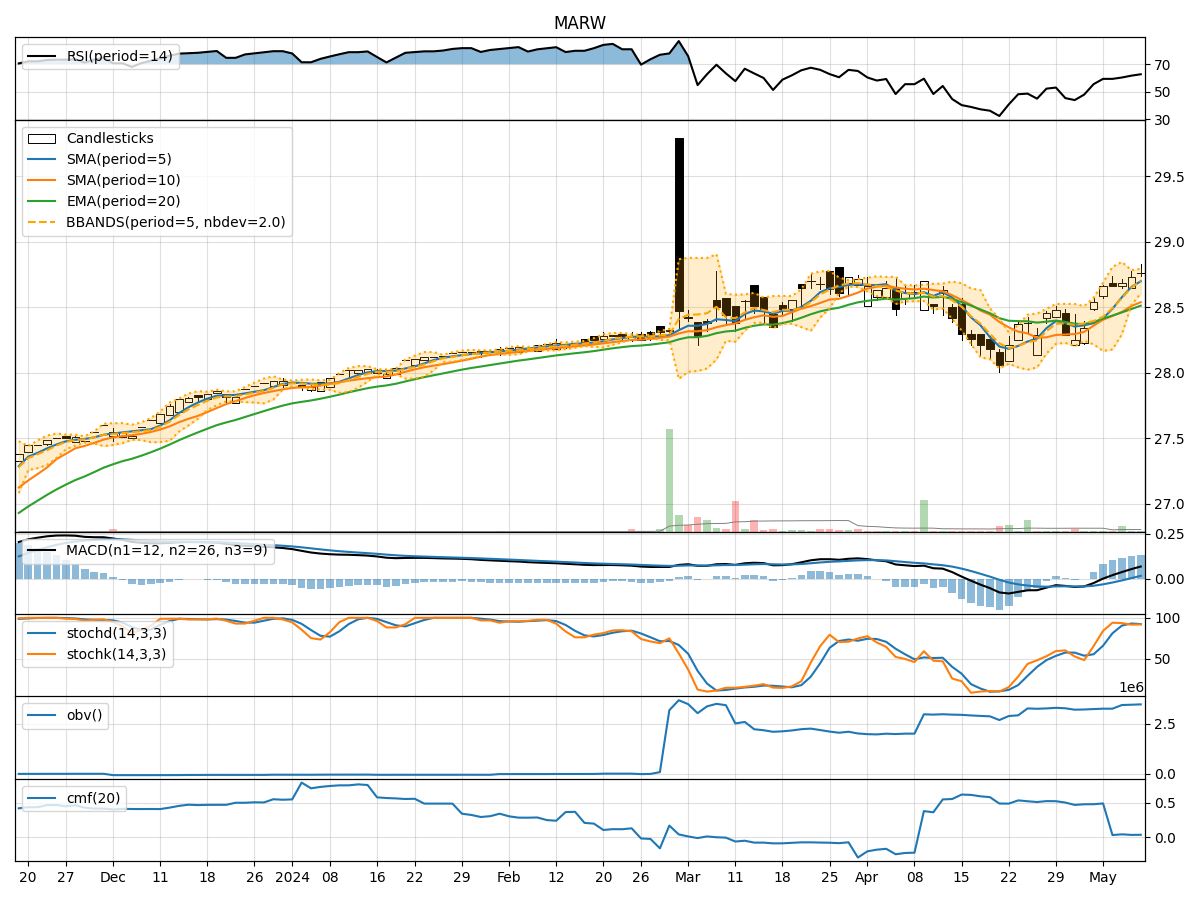
- Moving Averages (MA): The 5-day Moving Average has been consistently above the Simple Moving Average (SMA) and Exponential Moving Average (EMA), indicating a bullish trend.
- MACD: The MACD line has been above the signal line, with both lines showing an upward trend, suggesting bullish momentum.
- MACD Histogram: The MACD Histogram has been increasing, indicating strengthening bullish momentum.
Momentum Analysis:
- RSI: The Relative Strength Index (RSI) has been gradually increasing and is currently in the overbought territory, signaling a strong bullish momentum.
- Stochastic Oscillator: Both %K and %D lines of the Stochastic Oscillator have been in the overbought zone, indicating a strong bullish momentum.
- Williams %R: The Williams %R is in the oversold region, suggesting a potential reversal in the bullish momentum.
Volatility Analysis:
- Bollinger Bands: The stock price has been trading within the Bollinger Bands, with the bands narrowing, indicating decreasing volatility.
- Bollinger %B: The %B indicator is hovering around 0.8, suggesting the stock is trading close to the upper band.
Volume Analysis:
- On-Balance Volume (OBV): The OBV has been steadily increasing over the last 5 days, indicating strong buying pressure.
- Chaikin Money Flow (CMF): The CMF has been positive, reflecting buying pressure in the stock.
Key Observations:
- The trend indicators suggest a strong bullish sentiment, supported by the moving averages and MACD.
- Momentum indicators indicate an overbought condition, which might lead to a potential pullback.
- Volatility has been decreasing, indicating a possible period of consolidation.
- Volume indicators show consistent buying pressure, supporting the bullish outlook.
Conclusion:
Based on the analysis of the technical indicators, the next few days for MARW are likely to see continued upward movement in the stock price. However, given the overbought signals in the momentum indicators, there might be a short-term correction or consolidation before the bullish trend resumes. Investors should closely monitor the price action and key support levels for potential entry or exit points. Overall, the outlook remains bullish with a potential for a brief pullback in the near term.