Technical Analysis of MARZ 2024-05-10
Overview:
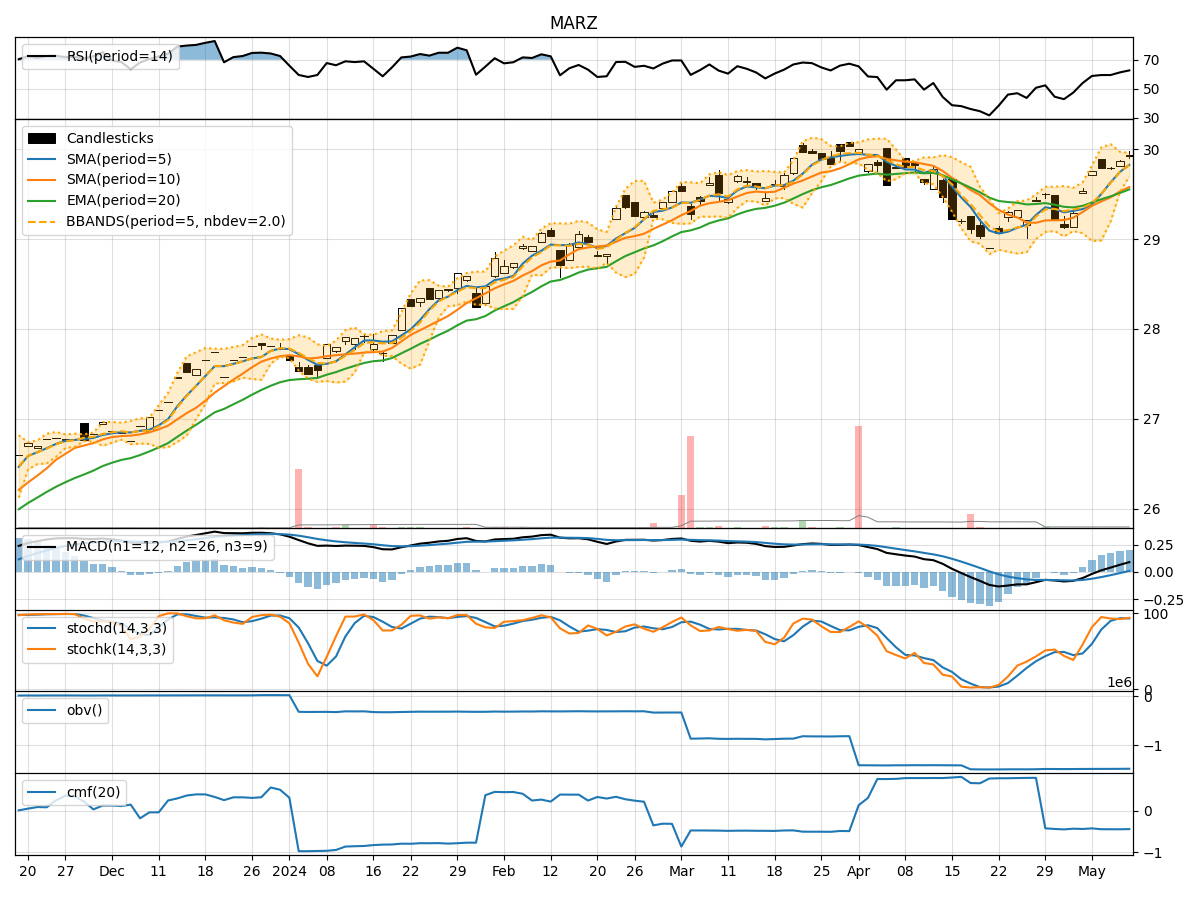
In analyzing the technical indicators for MARZ stock over the last 5 days, we will delve into the trend, momentum, volatility, and volume indicators to provide a comprehensive outlook on the possible future stock price movement. By examining these key indicators, we aim to offer valuable insights and recommendations for potential investors.
Trend Analysis:
- Moving Averages (MA): The 5-day Moving Average (MA) has been consistently above the Simple Moving Average (SMA) and Exponential Moving Average (EMA), indicating a bullish trend.
- MACD: The MACD line has been consistently above the signal line, with both lines showing an upward trend, suggesting bullish momentum.
- RSI: The Relative Strength Index (RSI) has been increasing and is currently in the overbought territory, indicating strong buying pressure.
Momentum Analysis:
- Stochastic Oscillator: Both %K and %D lines of the Stochastic Oscillator are in the overbought zone, suggesting a potential reversal or consolidation.
- Williams %R: The Williams %R is in the oversold region, indicating a potential buying opportunity.
Volatility Analysis:
- Bollinger Bands (BB): The stock price has been trading within the upper Bollinger Band (BBU), indicating an uptrend with increased volatility.
- BB% (BB Percentage): The BB% has been fluctuating around 0.7-0.9, suggesting moderate to high volatility.
Volume Analysis:
- On-Balance Volume (OBV): The OBV has been relatively stable, indicating a balance between buying and selling pressure.
- Chaikin Money Flow (CMF): The CMF has been negative, suggesting a net outflow of money from the stock.
Key Observations:
- The trend indicators suggest a strong bullish sentiment in the short term.
- Momentum indicators show signs of potential overbought conditions, indicating a possible reversal or consolidation.
- Volatility remains moderate to high, providing opportunities for traders to capitalize on price fluctuations.
- Volume indicators reflect a balanced market sentiment with a slight bias towards selling pressure.
Conclusion:
Based on the analysis of the technical indicators, the next few days' possible stock price movement for MARZ is likely to be upward in the short term due to the strong bullish trend indicated by moving averages and MACD. However, caution is advised as momentum indicators signal potential overbought conditions, which could lead to a reversal or consolidation. Traders should closely monitor price action and key support/resistance levels to make informed trading decisions.