Technical Analysis of MAXI 2024-05-10
Overview:
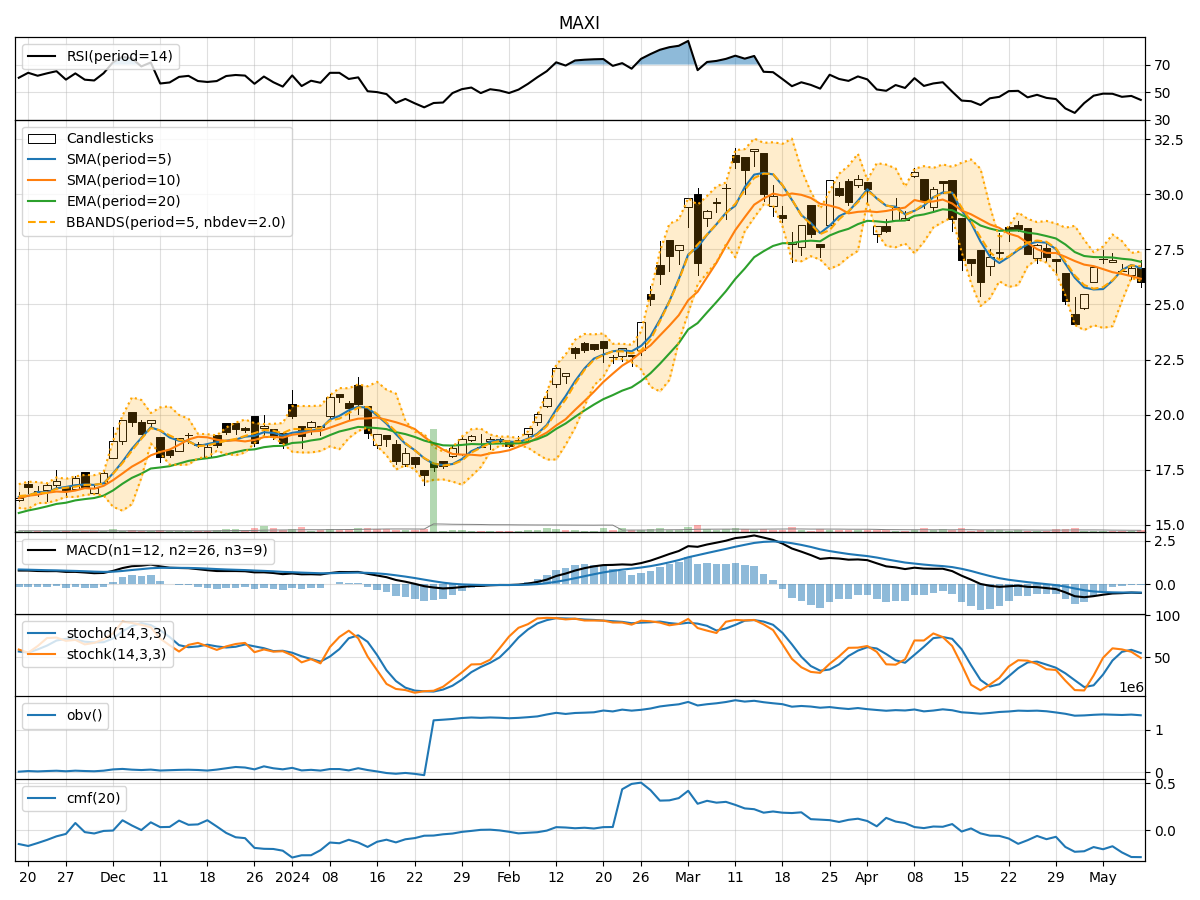
In the last 5 trading days, the stock price has shown a slight decline, accompanied by fluctuating volume levels. The trend indicators suggest a weakening trend, with moving averages and MACD signaling a bearish sentiment. Momentum indicators also indicate a lack of strong buying pressure, while volatility remains relatively stable. Volume indicators show a decrease in On-Balance Volume (OBV) and Chaikin Money Flow (CMF), indicating potential selling pressure.
Trend Indicators Analysis:
- Moving Averages (MA): The 5-day MA is below the 10-day SMA, indicating a short-term bearish trend.
- MACD: The MACD line is below the signal line, confirming a bearish trend.
- MACD Histogram: The MACD histogram is negative, suggesting downward momentum.
Momentum Indicators Analysis:
- RSI: The RSI is below 50, indicating a lack of strong buying momentum.
- Stochastic Oscillator: Both %K and %D are below 50, signaling a bearish momentum.
- Williams %R: The indicator is in oversold territory, suggesting a potential reversal.
Volatility Indicators Analysis:
- Bollinger Bands (BB): The price is currently within the bands, indicating stable volatility.
- Bollinger %B: The %B is close to 0, suggesting the price is near the lower band.
Volume Indicators Analysis:
- On-Balance Volume (OBV): The OBV has been decreasing, indicating selling pressure.
- Chaikin Money Flow (CMF): The CMF is negative, suggesting a lack of buying interest.
Key Observations:
- The stock is in a short-term bearish trend based on moving averages and MACD.
- Momentum indicators show a lack of strong buying pressure.
- Volatility remains stable, with the price near the lower Bollinger Band.
- Volume indicators indicate potential selling pressure with decreasing OBV and negative CMF.
Conclusion:
Based on the analysis of technical indicators, the stock is likely to experience further downward movement in the next few days. The bearish trend, lack of buying momentum, and selling pressure indicated by volume indicators suggest a continuation of the current downtrend. Traders and investors should exercise caution and consider shorting or staying on the sidelines until a clear reversal pattern emerges.