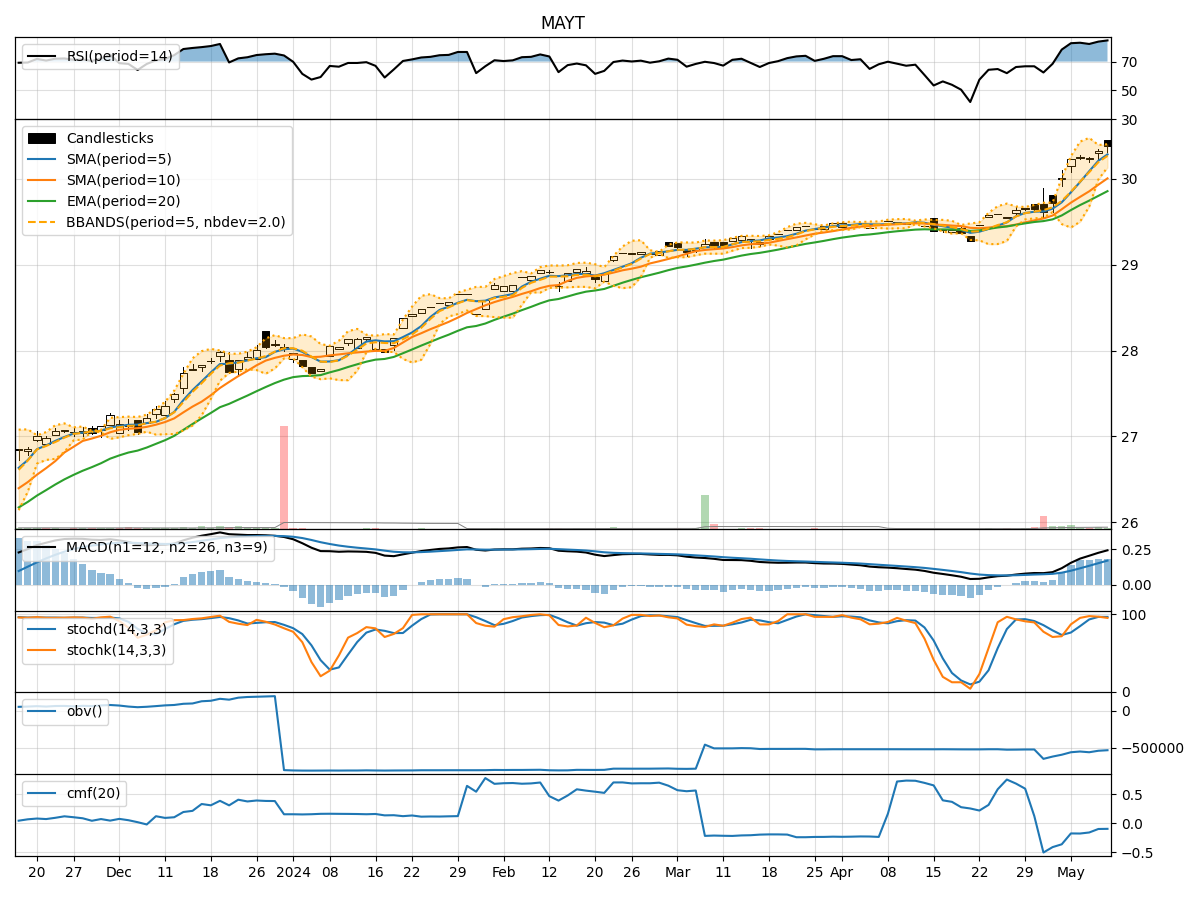
Technical Analysis of MAYT 2024-05-10
Overview:
In analyzing the technical indicators for MAYT stock over the last 5 days, we will delve into the trend, momentum, volatility, and volume indicators to provide a comprehensive outlook on the possible future stock price movement. By examining these key indicators, we aim to offer valuable insights and predictions for the upcoming trading days.
Trend Analysis:
- Moving Averages (MA): The 5-day Moving Average (MA) has been consistently above the Simple Moving Average (SMA) and Exponential Moving Average (EMA), indicating a bullish trend.
- MACD: The MACD line has been consistently above the signal line, with both lines showing an upward trend, suggesting bullish momentum.
- RSI: The Relative Strength Index (RSI) has been consistently above 70, indicating overbought conditions but also strong bullish momentum.
Momentum Analysis:
- Stochastic Oscillator: Both %K and %D lines of the Stochastic Oscillator have been in the overbought zone, suggesting a strong bullish momentum.
- Williams %R: The Williams %R has been consistently in the oversold territory, indicating a strong bullish sentiment.
Volatility Analysis:
- Bollinger Bands (BB): The stock price has been consistently trading above the middle Bollinger Band (BBM), indicating an upward trend with low volatility.
- Bollinger Band Width (BBW): The Bollinger Band Width has been narrowing, suggesting a potential decrease in volatility.
Volume Analysis:
- On-Balance Volume (OBV): The OBV has shown a slight increase over the last 5 days, indicating accumulation by investors.
- Chaikin Money Flow (CMF): The CMF has been negative, suggesting some selling pressure in the stock.
Key Observations:
- The stock is currently in a strong bullish trend based on moving averages, MACD, and RSI indicators.
- Momentum indicators like Stochastic Oscillator and Williams %R also support a bullish sentiment.
- Volatility is relatively low, as indicated by Bollinger Bands, with a narrowing Bollinger Band Width.
- The OBV shows accumulation, but the CMF indicates some selling pressure.
Conclusion:
Based on the analysis of the technical indicators, the next few days' possible stock price movement for MAYT is likely to continue in an upward direction. The strong bullish trend, supported by momentum indicators and low volatility, suggests that the stock may experience further price appreciation. Investors may consider buying or holding positions in MAYT stock for potential gains in the near term.