Technical Analysis of MAYW 2024-05-10
Overview:
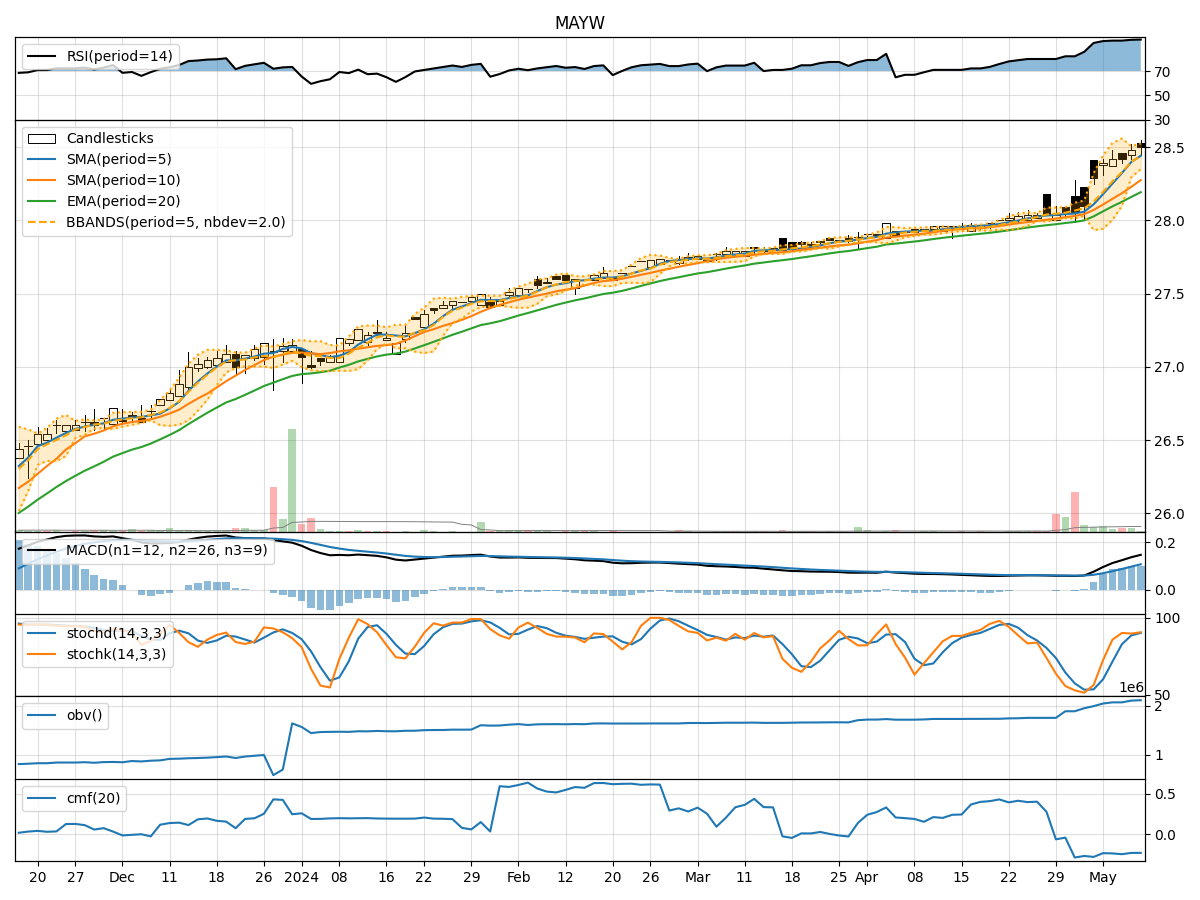
In analyzing the technical indicators for MAYW over the last 5 days, we will delve into the trend, momentum, volatility, and volume indicators to provide a comprehensive outlook on the possible stock price movement in the coming days. By examining these key indicators, we aim to offer valuable insights and predictions to guide investment decisions.
Trend Indicators:
- Moving Averages (MA): The 5-day MA has been consistently above the closing prices, indicating a bullish trend.
- MACD: The MACD line has been steadily increasing, with the MACD histogram also showing positive values, suggesting bullish momentum.
- EMA: The EMA has been trending upwards, supporting the bullish sentiment in the short term.
Momentum Indicators:
- RSI: The RSI values have been consistently high, indicating overbought conditions but also strong bullish momentum.
- Stochastic Oscillator: Both %K and %D values have been in the overbought territory, suggesting a strong upward momentum.
- Williams %R: The Williams %R values have been consistently negative, indicating a bearish sentiment.
Volatility Indicators:
- Bollinger Bands (BB): The stock price has been trading within the bands, with the bands narrowing, suggesting a potential breakout or consolidation.
- Bollinger %B: The %B value has been fluctuating around 0.8, indicating a relatively high price compared to the bands.
Volume Indicators:
- On-Balance Volume (OBV): The OBV has been relatively stable, indicating a balance between buying and selling pressure.
- Chaikin Money Flow (CMF): The CMF has been negative, suggesting a bearish sentiment in the market.
Key Observations and Opinions:
- Trend: The trend indicators point towards a strong bullish sentiment in the short term.
- Momentum: Despite overbought conditions, the momentum indicators suggest a continuation of the bullish trend.
- Volatility: The narrowing Bollinger Bands indicate a potential breakout, while the %B value suggests the stock is trading at higher levels.
- Volume: The volume indicators show a balance between buying and selling pressure, with a slight bearish bias indicated by the CMF.
Conclusion:
Based on the analysis of the technical indicators, the stock price of MAYW is likely to continue its upward trajectory in the coming days. The strong bullish trend supported by the moving averages, MACD, and RSI, coupled with the potential breakout indicated by the narrowing Bollinger Bands, suggests further upside potential. Traders and investors may consider buying opportunities in anticipation of a continued upward movement in the stock price.