Technical Analysis of MAYZ 2024-05-10
Overview:
In analyzing the technical indicators for MAYZ stock over the last 5 days, we will delve into the trend, momentum, volatility, and volume indicators to provide a comprehensive outlook on the possible stock price movement in the coming days. By examining these key indicators, we aim to offer valuable insights and predictions for potential investors.
Trend Analysis:
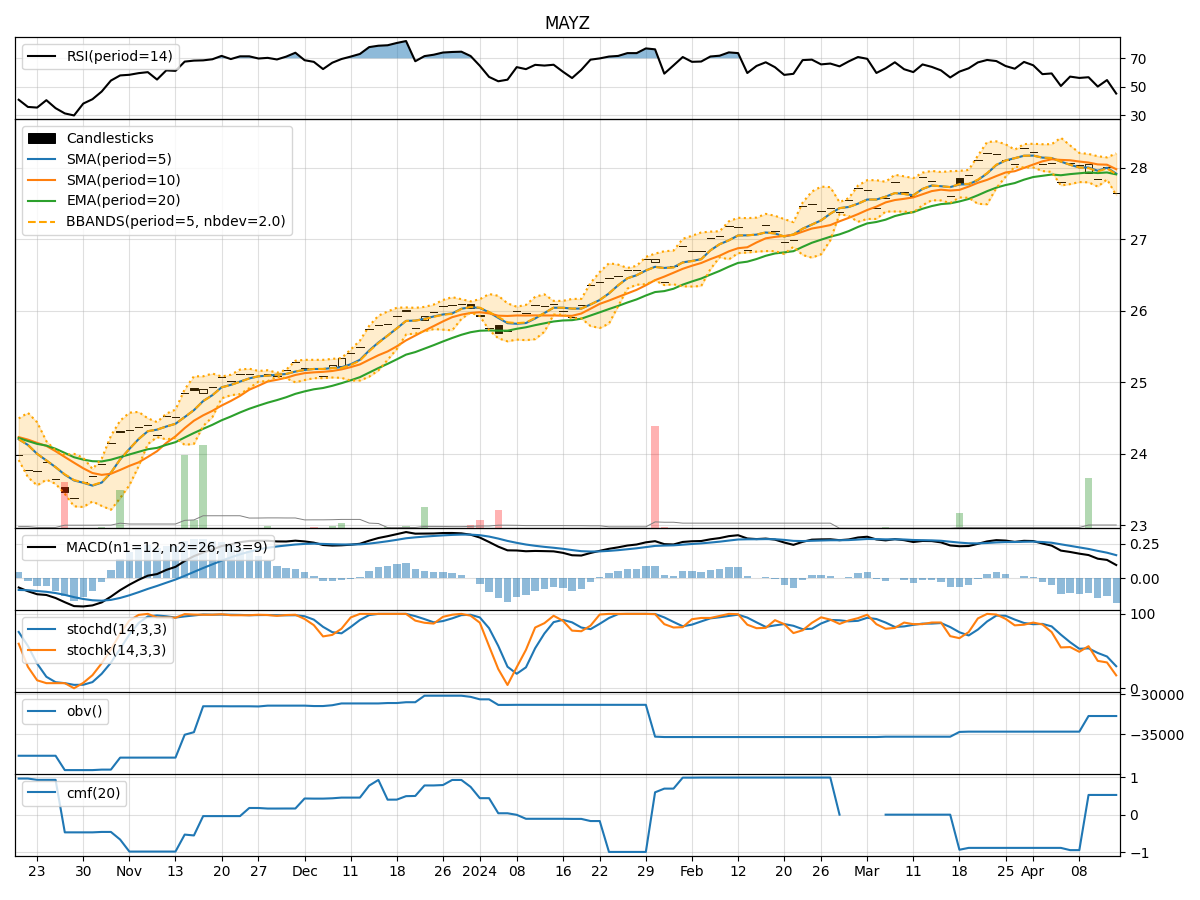
- Moving Averages (MA): The 5-day Moving Average has been consistently above the Simple Moving Average (SMA) and Exponential Moving Average (EMA), indicating a bullish trend.
- MACD: The MACD line has been consistently above the signal line, with both lines showing an upward trend, suggesting bullish momentum.
- MACD Histogram: The MACD Histogram has been increasing over the past 5 days, indicating strengthening bullish momentum.
Momentum Analysis:
- RSI: The Relative Strength Index (RSI) has been gradually increasing and is currently in the overbought territory, suggesting a strong bullish momentum.
- Stochastic Oscillator: Both %K and %D lines of the Stochastic Oscillator are in the overbought zone, indicating a potential reversal or consolidation.
- Williams %R: The Williams %R is also in the overbought region, signaling a possible pullback in the stock price.
Volatility Analysis:
- Bollinger Bands: The Bollinger Bands are narrowing, indicating decreasing volatility and a potential period of consolidation.
- Bollinger %B: The %B indicator is hovering around 0.8, suggesting that the stock is trading near the upper band, potentially indicating an overbought condition.
Volume Analysis:
- On-Balance Volume (OBV): The OBV has been relatively stable over the past 5 days, indicating a balance between buying and selling pressure.
- Chaikin Money Flow (CMF): The CMF has been negative, suggesting that money may be flowing out of the stock.
Conclusion:
Based on the analysis of the technical indicators, the stock is currently exhibiting strong bullish momentum in the short term. However, with the stock being in the overbought territory according to multiple indicators like RSI, Stochastic Oscillator, and Williams %R, there is a likelihood of a pullback or consolidation in the coming days. The narrowing Bollinger Bands also support the view of a potential period of consolidation.
Recommendation:
- Short-Term: Considering the overbought conditions and potential consolidation, it may be prudent to exercise caution in initiating new long positions at the current levels.
- Long-Term: Investors with a long-term perspective may consider waiting for a pullback to enter positions at more favorable levels.
Key Takeaways:
- Bullish Momentum: Strong bullish momentum in the short term.
- Overbought Conditions: Multiple indicators signaling overbought conditions.
- Potential Consolidation: Likelihood of a pullback or consolidation in the near future.