Technical Analysis of MBCC 2024-05-10
Overview:
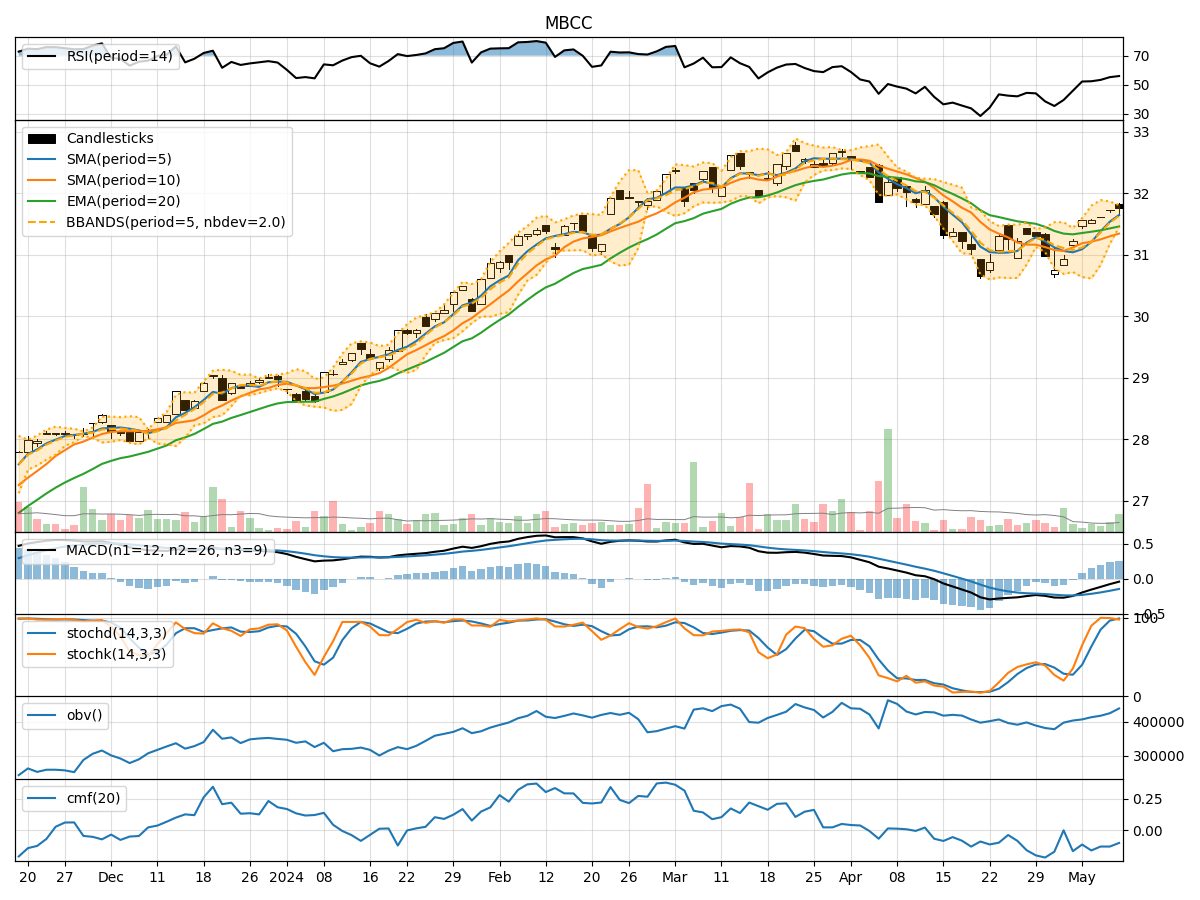
In analyzing the technical indicators for MBCC over the last 5 days, we will delve into the trend, momentum, volatility, and volume indicators to provide a comprehensive assessment of the stock's potential price movement. By examining these key factors, we aim to offer valuable insights and predictions for the next few days.
Trend Analysis:
- Moving Averages (MA): The 5-day Moving Average (MA) has been consistently above the Simple Moving Average (SMA) and Exponential Moving Average (EMA), indicating a short-term uptrend.
- MACD: The Moving Average Convergence Divergence (MACD) has been negative but showing signs of convergence towards the signal line, suggesting a potential reversal in the trend.
Momentum Analysis:
- RSI: The Relative Strength Index (RSI) has been hovering around the neutral zone, indicating a balanced momentum in the stock.
- Stochastic Oscillator: The Stochastic Oscillator is in the overbought territory, suggesting a potential reversal or consolidation in the near term.
Volatility Analysis:
- Bollinger Bands (BB): The Bollinger Bands have been narrowing, indicating decreasing volatility in the stock price.
- Bollinger Band Percentage (BBP): The BBP is increasing, suggesting a potential breakout or significant price movement in the near future.
Volume Analysis:
- On-Balance Volume (OBV): The OBV has been showing positive accumulation, indicating buying pressure in the stock.
- Chaikin Money Flow (CMF): The CMF has been negative, reflecting a slight distribution phase in the stock.
Key Observations:
- The trend indicators suggest a potential reversal or consolidation in the short term.
- Momentum indicators point towards a balanced momentum with a possibility of a pullback.
- Volatility indicators indicate decreasing volatility but hint at a potential breakout.
- Volume indicators show positive accumulation but with a slight distribution phase.
Conclusion:
Based on the analysis of the technical indicators, the next few days' possible stock price movement for MBCC is sideways consolidation with a slight upward bias. Traders should watch for a potential breakout as volatility increases, while also being cautious of the overbought levels in the Stochastic Oscillator. Overall, the stock is likely to trade within a range with a potential for a modest uptick in the near future.